Download
1 / 17
170 likes | 295 Views
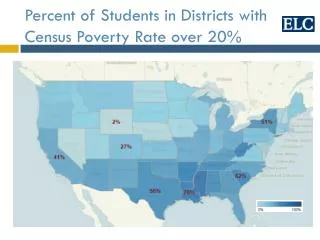
Percent of Students in Districts with Census Poverty Rate over 20%. Fair School Funding: Core Principles . States should provide varying levels of funding to ensure equal educational opportunities to children with different needs.

E N D
Percent of Students in Districts with Census Poverty Rate over 20%
Fair School Funding: Core Principles • States should provide varying levels of funding to ensure equal educational opportunities to children with different needs. • A “progressive” finance system allocates more funding to districts with high levels of student poverty; a “regressive” system allocates less to those districts; and a “flat” system allocates roughly the same across districts with varying needs.
State C (Avg. implicit base rev., progressive) State B (Avg. implicit base rev., highly regressive) State & Local Revenue per Pupil State A (Low revenue, poverty “flat”) Low Poverty High Poverty
New Jersey Math Achievement Trends 4th Grade NAEP 260 White, 255 250 White, 248 240 National Ave., 239 White, 239 White, 236 Hispanic, 234 Black, 232 230 National Ave., 226 Hispanic, 224 NAEP Scale Score National Ave., 222 220 Black, 217 National Ave., 219 210 Hispanic, 206 Black, 204 Hispanic, 204 200 Black, 198 190 1992 1996 2003 2007 Source: National Assessment of Educational Progress, NAEP Data Trends What Happens When States Make Smart and Equitable Investments? CA, 230
New Jersey Math Achievement Trends 4th Grade NAEP 260 White, 255 250 White, 248 240 National Ave., 239 White, 239 White, 236 Hispanic, 234 Black, 232 230 National Ave., 226 Hispanic, 224 NAEP Scale Score National Ave., 222 220 Black, 217 National Ave., 219 210 Hispanic, 206 Black, 204 Hispanic, 204 200 Black, 198 190 1992 1996 2003 2007 Source: National Assessment of Educational Progress, NAEP Data Trends What Happens When States Make Smart and Equitable Investments? CA, 230
State Pre-K Enrollment Source: The State of Preschool 2011, The National Institute for Early Education Research
Poverty: What Can We Do? • Fair School Funding: Essential precondition to improving high need schools and boosting achievement • Key to teacher quality/equity; supplemental programs for at-risk, ELL students • State school finance reform: “Deep Resistance” • Federal Policies: subsidize state finance inequity; use federal funds to leverage states to improve funding fairness
Poverty: What Can We Do? • Access to high quality Pre-K for every low income child, and every child in a low income community • State Pre-K Systems: unify Head Start, Child Care and Public School Pre-K • Right to attend school in safe and educationally adequate facilities • State capital program – assess need, ensure financing