Download
1 / 25
250 likes | 477 Views
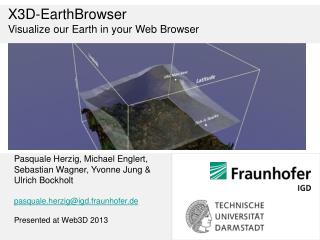
Pasquale Herzig, Michael Englert, Sebastian Wagner, Yvonne Jung & Ulrich Bockholt pasquale.herzig@igd.fraunhofer.de Presented at Web3D 2013. X3D-EarthBrowser Visualize our Earth in your Web Browser. EarthServer. http://www.earthserver.eu/ Funded by EU e-Infrastructure

E N D
Pasquale Herzig, Michael Englert, Sebastian Wagner, Yvonne Jung & Ulrich Bockholt pasquale.herzig@igd.fraunhofer.de Presented at Web3D 2013 X3D-EarthBrowser Visualize our Earth in your Web Browser
EarthServer • http://www.earthserver.eu/ • Funded by EU e-Infrastructure • Project Number: 283610 • Open-access, ad-hoc analytics on extreme-size earth science data • RTD & services, six lighthouse applications
EarthServer • Different domains of earth science with unique challenges - including visualization • E.g.: Cryospheric, atmospheric and planetary science, geology and oceanography, etc. • Potentially looking for very different things to display
EarthServer • Aim: 100+ TB of raster data each • Server/Client architecture, OGC standards on top of HTTP as “glue” • WCS,WMS,WCPS • OGC standards development also part of the project • Servers designed to deal with big data, clients request manageable subsets • This talk: focus on 3D web client
Visualizations in X3DOM • Open Source middleware for declarative 3D on the web -> Tutorials yesterday • http://www.x3dom.org
Web 3D Client • Aim: display raster data in a 3D environment on a web page • Raster data comes in many varieties • 1 to 3 spatial dimensions, optionally combined with a temporal dimension • uniform and various types of non-uniform grids, general meshes etc. • multiple coverages (datasets) sometimes necessary for meaningful results • 1 to n channels of different types • ... and plenty more...
Web 3D Client • Also may need different visualizations of any coverage type. • Planes • Elevation Maps • Point Clouds • Time Series • Volume rendering • ... • Plenty of “3D widgets” you could think of
Web 3D Client • Also, may want to combine different “widgets” in one display • And that’s just visualization. • There is also interaction • Some basics (like navigation) are baseline, but how to anticipate all the custom interaction schemes users might want?
Web 3D Client • Now, what is a 3D web client then? • In the first year, we made a few prototypes, each addressing a different scenario • They all have in common that they display something in a 3D box rather than e.g. on a globe • Internally dubbed the “fishtank”
Unified Client • Our aim was not to deliver just a bunch of semi-related code solving very specific problems. • One 3D web client to rule them all. • On desktops as well as mobile devices.
Unified Client • Our solution: make client modular and split setup and execution • Operator gets all the power at source code level to set up the application, may even write custom modules if necessary
Unified Client • The unified client consists of • a framework with a module API • modules • UI & tools • E.g. a module that has API to setup WCPS call that will request RGBA image and add it to scene as elevation map • Framework has composition functionality like transformations and transparency
User Interface - Using JQueryUI • Created automatically • Basics for modules • Movement, scaling, transparency.. • Settings for light, cameras & annotations • Easy to change and to adopt
Progressive Data Transmission • Load low resolution data first • Increase resolution after a succesfull query • Add higher resolution when available • Quicker feedback for the user • The protocols allow to choose the resolution
Summary • Web clientusing X3DOM andnoplugins • Except IE (X3DOM Flash fallback) • Easy tosetupbyoperators • FewlinesofJavascriptcode • Combine datafrom different sources • Services for e.g. geology and oceanography • Combine different visualizationtypes • Elevation map, underground, pointcloud…
What’s Next? • Performance • Less Javascript, more shader in X3DOM • User Experience • better UI feedback • Interaction • e.g. UI for positioning planes and callbacks into application code to handle change events • More modules
Thank You! • Feel free to contact me or the EarthServer community. • pasquale.herzig@igd.fraunhofer.de • http://www.earthserver.eu • Questions? • More technical details in the paper.