Investigating Water Quality
180 likes | 351 Views
Investigating Water Quality How do excess nutrients affect dissolved oxygen levels & impact water quality?. Water Quality: Dissolved Oxygen. Below is what water looks like when the oxygen level is too low for the number of plants and animals using the aquatic habitat.

Investigating Water Quality
E N D
Presentation Transcript
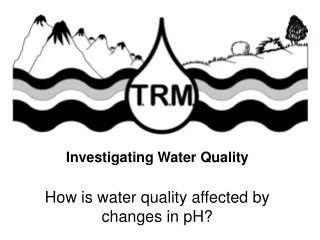
Investigating Water Quality How do excess nutrients affect dissolved oxygen levels & impact water quality?
Water Quality: Dissolved Oxygen Below is what water looks like when the oxygen level is too low for the number of plants and animals using the aquatic habitat. • Dissolved oxygen is molecular oxygen freely available in water and necessary for the respiration of aquatic life and the oxidation of organic material.
Water Quality: Nutrients and Nutrient loading • Nutrients are elements or compounds essential to life, including but not limited to oxygen, carbon, nitrogen, and phosphorus. • Nutrient loading is the addition of nutrients, usually nitrogen or phosphorus, to a water body (often expressed as g/m2 of lake surface area per year) . The majority of nutrient loading in a lake usually comes from its tributaries.
Nutrients are supposed to be good but too much of anything is a problem especially when aquatic plants & microorganisms take over. • Sources include agricultural runoff with nitrogen rich fertilizers, waste water treatment plants, septic systems, and detergents using phosphates.
Fig 5.12 EPA • Phosphorus cycles through the environment, changing form as it does so (Fig. 5.12). Aquatic plants take in dissolved inorganic phosphorus and convert it to organic phosphorus as it becomes part of their tissues. Animals get the organic phosphorus they need by eating either aquatic plants, other animals, or decomposing plant and animal material. • As plants and animals excrete wastes or die, the organic phosphorus they contain sinks to the bottom, where bacterial decomposition converts it back to inorganic phosphorus
Environmental Protection Agency http://omp.gso.uri.edu/ompweb/doee/science/physical/choxy2.htm • Water becomes stratified • The bottom layer becomes toxic • Aquatic organisms compete for DO in warmer & vulnerable surface waters.
What is the relationship between water temperature and dissolved oxygen? http://ga.water.usgs.gov/edu/dissolvedoxygen.html
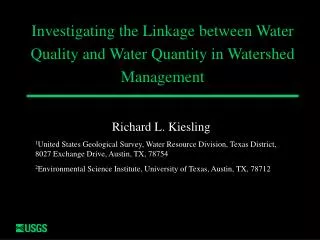
WA Department of Ecology 2008-2009 Water Quality Testing DataPhosphorus, Nitrogen & Dissolved Oxygen Columbia River @ Grand Coulee Hawk Creek Kettle River near Barstow North Port http://www.ecy.wa.gov/programs/eap/fw_riv/rv_main.html
61A070 - Columbia R @ Northport LOCATED AT THE BRIDGE CROSSING THE COLUMBIA RIVER ON STATE HIGHWAY 25, IMMEDIATELY NORTHEAST OF NORTHPORT Overall water quality at this station is of moderate concern. (based on water-year 2008 summary)
60A070 - Kettle R nr Barstow Barstow LOCATED 10.9 MILES FROM THE MOUTH OF THE KETTLE RIVER, .75 MILES EAST OF BARSTOW ON THE FERRY-STEVENS COUNTY LINE Overall water quality at this station is of moderate concern. (based on water-year 2008 summary)
53A070 - Columbia River @ Grand Coulee LOCATED AT THE COULEE DAM BRIDGE .5 MILES BELOW GRAND COULEE DAM Data years 1949 - 2010 Overall water quality at this station met or exceeded expectations and is of lowest concern. (based on water-year 2009 summary)
53C070 - Hawk Creek @ Miles-Creston Rd. Hawk Creek Location: From Grand Coulee: Head southwest on Hwy 174 towards Wilbur. Turn left onto Hwy 2 heading towards Wilbur/Creston. After traveling past Creston ~6 miles, turn left onto Miles-Creston Rd. Follow until the road crosses Hawk Creek. Park on the near side of the bridge on the left hand side of the road. Overall water quality at this station did not meet expectations and is of highest concern. (based on water-year 2009 summary)
Hawk Creek 2008 -2009 WQ Data What does the data show about the relationship between temperature and oxygen?
Compare the graphs for Oxygen and total nitrogen & phosphorus Explain the data trends for columns 6-8 Feb - April
Hawk Creek 2008 -2009 WQ Data For which months is • Total Phosphorus highest? • Total Nitrogen highest? • Oxygen Lowest? • What is happening in June that explains the data trends?
Do the data show patterns or local circumstances? • Analyze the WQ data for • Grand Coulee • Kettle River and • North Port • Compare the three locations to Hawk Creek? Find any similarities & differences.