Download
1 / 15
150 likes | 263 Views
This research paper explores uncertainty estimation in transpiration models, focusing on the Penman-Monteith equation. It compares Bayesian analysis with a novel fuzzy set representation of uncertainty, addressing limitations in traditional deterministic models. It discusses the calibration of parameters, data availability, and the impact of model complexity on parameter estimates and uncertainty. Key questions include the efficacy of fuzzy sets versus probabilistic approaches and the degree of uncertainty representation. The study utilizes data from the ChEAS site in Wisconsin to evaluate techniques and model structures.

E N D
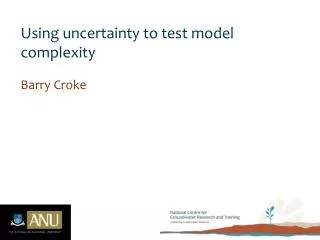
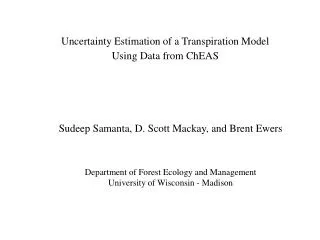
Uncertainty Estimation of a Transpiration Model Using Data from ChEAS Sudeep Samanta, D. Scott Mackay, and Brent Ewers Department of Forest Ecology and ManagementUniversity of Wisconsin - Madison
Uncertainty in Model Selection/Calibration • Select model structure consistent with current knowledge • Many alternatives • Estimate appropriate values for parameters • Data availability • Methods of comparing model output to data
Problem Statement • Deterministic Simulation models: An Example R = P - ET - ΔS ET = M(Rn, D, ga, gc) gc = gsL gs = gsmaxf1(D)f2(Q)... • Easier than stochastic models to build and interpret • No estimate of uncertainty directly available from a model • Difficult to formulate in stochastic terms to obtain a probabilistic estimate of uncertainty
Bayesian Analysis • Bayesian analysis of deterministic models: i = 1, 2, …., n, • Posterior estimates of parameter distribution • Uncertainty in Predictions • Changes in model component may change error model • The errors may be auto-correlated
Research Questions • Can inferences be made without probabilistic assumptions using an alternative representation of uncertainty? • Fuzzy set theory • Objective function as membership grade • Can be used without reformulating model • Flexible in terms of selection criteria • How does this representation compare with probabilistic representation of uncertainty? • Does the ability to identify parameters and their relationships change with model complexity?
1 Crisp Set Fuzzy Set 0.75 Membership Grade 0.5 0.25 0 0 2 4 6 8 10 Real numbers Crisp and Fuzzy Sets • Crisp sets - precise boundary vs. Fuzzy sets - imprecise boundary • Degree of compatibility with a concept - membership grade
1 0.75 Subnormal Fuzzy Set α-cut #1 Membership Grade 0.5 α-cut #2 0.25 0 0 2 4 6 8 10 Real numbers Subnormal Fuzzy Sets • Highest membership grade less than 1 • Crisp sets can be formed by placing an α-cut • higher the α-cut, lower the number of members in the crisp set
Uncertainty in Fuzzy Sets log2|S| = U(r) # of members |S1| α-cut #1 |S2| α-cut #2 α • Crisp sets obtained through principle of uncertainty invariance [Klir and Wierman, 1998]
Limitations Compared to Bayesian Analysis of Uncertainty • Inferences may not be valid outside the sampled model parameter combinations • Uncertainty is represented by a set and no likelihood distribution is available • Theories and application techniques are not as well developed
Transpiration Model • Penman-Monteith equation (Monteith, 1965) • Stomatal conductance model (Jarvis, 1976) gS = gSmax f1(D) f2(Q0)…. • Data from ChEAS site, WI
Comparison of Techniques δ • Model details:Canopy modeled as a big leaf logarithmic wind speed profile • . gs = gsmax*(1-δD) • . gs = gsmax*(1-δD)*min[Qrl/Qmin, 1] • Analysis:Bayesian and proposed framework gsmax
Comparison of Techniques gs = gsmax*(1-δD)*min[Qrl/Qmin, 1] • Model details: • Canopy divided in sunlit and shaded leaf areas, • . logarithmic wind speed profile. • . stability corrections with factors for roughness lengths fixed. • Analysis: Bayesian and proposed framework
Parameter Estimates with Increasing Model complexity • Model details:Canopy layers with sunlit and shaded leaf areas Wind speed profile modeled in canopy. gs = gsmax*(1-δD)*min[Qrl/Qmin, 1] • . parameters for ga assumed known • . parameters for ga calibrated • Analysis: proposed framework
boundary layer Parameter Estimates with Increasing Model complexity • Model details:Canopy layers with sunlit and shaded leaf areas Wind speed profile modeled in canopy. • Boundary layers at each canopy layer.gs = gsmax*(1-δD)*min[Qrl/Qmin, 1] • . parameters for ga assumed known • . parameters for ga calibrated • Analysis: proposed framework
Anticipated Results Comparison of Techniques • Relations between uncertainty estimates obtained by the two techniques would not change with model complexity Parameter Estimates and Increased Model Complexity • Similar but tighter parameter estimates obtained when model complexity is increased without increasing number of parameters • The estimates will become more indeterminate with increased number of calibrated parameters