Download
1 / 32
320 likes | 481 Views
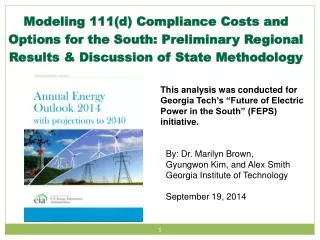
A Model for Estimating Costs of Demand Response Programs: Providing Supplementary Analysis to the Eastern Interconnection Planning Collaborative. Stanton W. Hadley Oak Ridge National Laboratory. Marilyn A. Brown Georgia Institute of Technology. Alexander M. Smith

E N D
A Model for Estimating Costs of Demand Response Programs: Providing Supplementary Analysis to the Eastern Interconnection Planning Collaborative Stanton W. Hadley Oak Ridge National Laboratory Marilyn A. Brown Georgia Institute of Technology Alexander M. Smith Georgia Institute of Technology August 2011
Background and Purpose • EIPC Gathers Grid Planning Authorities • Modeling Impacts of Grid Policy Options for the Eastern Interconnection • Municipal, State, and Federal policy-makers • Stakeholders: Environmental & Consumer Advocacy NPOs, Generation Industry • Using CRA’s NEEM Model • General Equilibrium model for energy economics
Background and Purpose • NEEM models eight “futures” with sensitivities • BAU: 55,096 MW-avoided of DR added by 2040 • Future 4: “Aggressive EE/DR/DG” • 179,498 MW-avoided of DR added by 2040 • Future 4, Sensitivity 3: “Hyper-Aggressive DR” • 227,069 MW-avoided of DR added by 2040 • How to compare costs of DR to other options? • DR considered equivalent to peak generation • Can reduce demand instead of increasing supply • Peak generator costs tractable: DR costs…not • Hence, a model for estimating DR costs
Part One: Creation of the “Demand Response Incremental Program Costs by Region per Year” model (D.R.I.P.C.R.Y.)
A “System Costs” Approach • Three Main Categories: • Administrative Program Costs (labor, data) • Capital Program Costs (hardware, AMI) • Transaction Costs (consumer informing self) • Exogenous Cost is price paid by “system” • Challenges: • Non-competitive AMI markets (prices are chosen) • No disclosure of operation & administrative costs • Transaction costs difficult to quantify • Primary focus is capital costs (best-known)
“Taxonomy” of DR Programs • DR programs very diverse • Distributor and customer make own terms • FERC’s has made DR a “strategic initiative” • EISA (2007): FERC must assess DR in US • Provides useful classification of DR programs
Sources: All (links, abbreviations) • Multiple authoritative sources within 2 years • EPRI, KEMA, SGIG: Costs-per-customer • NADR, FERC: MW-avoided-per-customer • EIA: Direct source for $/MW-avoided
Sources: EPRI (2011) • EPRI (2011) “Estimating Costs and Benefits of the Smart Grid” • Per-unit costs of AMI, other non-DR infrastructure (Source: EPRI (2011)
Sources: KEMA (2009) Residential Service • KEMA (2009) • CA Solar Initiative • Studies AMI to be used in large PV installations • Features similar to AMI used for DR • Communications • Interval metering • Data management Commercial and Industrial Service (Source: KEMA 2009)
Sources: DOE SGIG (2010) (Source: DOE SGIG 2010) • DOE (2010) “SGIG Project Recipients” • Category One: AMI • Provides total budget, number of meters installed • Calculated cost-per-meter for each
Sources: DOE SGIG (2010) • Source slightly ambiguous • No breakdown of budgets • Some AMI projects not relevant to DR • Filter by project descriptions (e.g. gas & water metering) • First public empirical information about AMI costs • AMI suppliers price by customer (P ≠ MC) • Provides a range
Sources: EIA (2009) • EIA Form 861: Survey of all US IOUs • File 3 provides information about DR and AMI • Most recent data are from 2009 • Offers MW-avoided by customer category • Residential, C&I, Gov., and Transportation (?) • Offers “direct costs to utilities of DR program” • What this represents is unclear/ambiguous • As expressed, is endogenous, not exogenous cost • May calculate $/MW-avoided from data • ..but estimates thus produced are extremely low
Sources: NADR (2009) • FERC’s 2009 National Assessment of Demand Response • Produces NADR model • Forecasts DR to 2020 • Provides MW-avoided/customer • Provides changes over the years • Dynamic modeling
Sources: FERC (2011) • FERC’s 2011 survey of AMI and DR • Results also from 2009 • Provides MW-avoided/customer • Larger number of utilities than EIA • RECs, Muni’s included • More DR program types than NADR • Static – only year-2009 Ambiguity issue: LOAD AGGREGATORS
Sources: FERC (2011) + EIA (2009) • Combination of FERC’s 2011 survey with EIA Form 861 • Cross-referenced FERC (2011) with EIA data • Both report MW-avoided for programs in 2009 • FERC offers number of customers per program, EIA offers MW-avoided per program • Combined to get MW-avoided-per-customer • Can directly estimate $/MW-avoided using the program’s “direct cost to utilities” from EIA • …but these estimates are also extremely low
Inputs: The NEEM Model • NEEM receives inputs of peak MW-avoided through DR programs • Amounts derived through stakeholder process • Annual total peak MW-avoided provided • Take differences for incremental MW-avoided • 2010 is “base year:” all DR installed to-date • NPVs calculated for 2015-2030 period • Same period considered for peak generators
Inputs: The NEEM Model • Problem: Cartographic Challenges • NEEM has own regional definitions of US • FERC, NADR data are reported by NERC regions • Must convert from NEEM to NERC, compute costs, then convert back again from NERC to NEEM • Solution: Matrix method • Essentially based upon creator’s judgment • Fortunately, consistent with previous methods used to convert NEMS regions to NEEM regions • Able to leverage NEMS conversion tables…
Method: Cartographic Conversions • Used NEMS regions as intermediary • Can thus produce DR costs by NEMS region, in addition to NERC/NEEM NEEM Regions NEMS Regions NERC Regions
Method: DR “Portfolios” • FERC, NADR report by NERC region • Filtered Data by NERC region to identify portions of DR MW-avoided held by each program type • Developed “DR Portfolio” for each region = granularity in program costs • NADR Advantage: Shows changes to DR Portfolios over the 30-year period • e.g. RES,DLC will grow while CNI,DYN remains constant • FERC (2011) doesn’t show changes to DR portfolios
Method: Costs-per-MW ÷ • THE UPPER BOUND • NADR MW/customer lower than FERC MW/customer, so $/MW higher
Method: Costs-per-MW ÷ • THE LOWER BOUND • FERC MW/customer higher than NADR MW/customer, so $/MW lower
Method: Costs-per-MW • KEMA LOW has been recommended to the EIPC SSC/MWG • Wide range captures most of the other estimates • KEMA HIGH brings DR $/MW closest to peak generation $/MW (~$400,000)
Method: Cartographic Conversions (Reversal) • Reverse conversions allocate DR costs to each regional set NERC Regions NEMS Regions NEEM Regions
Results: NPV Calculations • Performed for year 2015-2030 • Interest rate = 5% • Same period and interest rate for peak generation
Feedback: What are your thoughts? • Alternate sources for AMI costs? • Other DR-relevant costs? • Any sources seem unrealistic? Credentials? • Is a utility-costs approach acceptable? • Why/Why-not? • Refinements to methods? • Policy-relevant applications of this model? • Cross-referencing? Double-counting issues? • (just because this came up at previous WOPRs…)