Download
1 / 23
230 likes | 366 Views
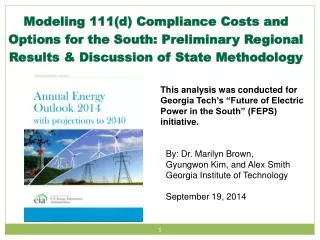
Modeling 111(d) Compliance Costs and Options for the South: Preliminary Regional Results & Discussion of State Methodology. This analysis was conducted for Georgia Tech’s “Future of Electric Power in the South” (FEPS) initiative. By: Dr. Marilyn Brown, Gyungwon Kim, and Alex Smith

E N D
Modeling 111(d) Compliance Costs and Options for the South: Preliminary Regional Results & Discussion of State Methodology This analysis was conducted for Georgia Tech’s “Future of Electric Power in the South” (FEPS) initiative. By: Dr. Marilyn Brown, Gyungwon Kim, and Alex Smith Georgia Institute of Technology September 19, 2014
NEMS as a Tool for Studying 111(d) Compliance Costs and Options “NEMS projects the production, imports, conversion, consumption, and prices of energy, subject to assumptions on macroeconomic and financial factors, world energy markets, resource availability and costs, behavioral and technological choice criteria, cost and performance characteristics of energy technologies, and demographics. ” -- EIA 2009 NEMS Overview MethodologyNational Energy Modeling System (NEMS)
We’re Using GT-NEMS to Model 111(d) Compliance Costs and Options • NEMS Uses 22 NERC Regions to Forecast Electricity Supply and Demand • As a first step we use state level “constraints” to characterize the 111(d) “goals” of the 7 NERC regions in the South • Source of state mass constraints used: IPM Outputs of the Regulatory Analysis of the Clean Power Plan. IPM modeling results are available from the Option 1-State file at: http://www.epa.gov/airmarkets/powersectormodeling/cleanpowerplan.html
Modeling a Carbon Tax on the Electricity Sector to Estimate the “Shadow Cost” of 111(d) Compliance • EIA has published a GHG25 “side case” that applies an economy-wide $10 or $25/metric tons of CO2 tax starting in 2015 • The GHG25 case assumes a policy that applies a fee on carbon dioxide emissions (in 2012 dollars) starting at $25 per metric ton in 2015 and escalating by 5% per year to about $85 per metric ton in 2040 (AEO 2014). • GT-NEMS has modeled a $10, $15, $20 and$25/metric tons of CO2 tax starting in 2018 and applied only to electric power sector.
Higher 111(d) Compliance Costs in the South? • These preliminary results suggest that the cost of 111(d) compliance may be higher in the NERC regions of the South than in the rest of the nation • This tentative conclusion will be examined further
What is the BSER for Regions and States in the South? • Natural gas and renewable energy are projected to grow • Some (or much) coal is retired • Consumption would decline relative to the reference case • Nuclear would increase in some regions BSER = Best System Of Emissions Reduction 44% 61% 124% 1% 2% 26% 25% 28% 59% -14% -19% -42% 12% -3% -66%
Fuel Changes by NERC Region • In the case of $25/metric tonnes of CO2 fee, • TRE: Coal & petroleum decrease & RE & NG grow. • FRCC: Nuclear displaces coal, petroleum and NG. No growth in NG. • SRDA, SRSE: NG displaces coal and petroleum. • SRCE: Nuclear displaces coal and petroleum. • SRVC & SPPS: Expected significant growth in RE.
Next Steps for This Regional Analysis • Improve the weighting approach for estimating the carbon constraints of each NERC region (we know the land area weighting is flawed) • Revise the GT-DSM code to reflect more affordable supply curves for solar and energy efficiency including CHP • Redo the analysis of carbon taxes with these updates included, to re-estimate the NERC region “shadow prices” of 111(d) compliance under alternative technology trajectories
GT-NEMS Can Estimate 111(d) Compliance Costs and Options of Individual States • As a second step, we plan to estimate the 111(d) compliance costs and options of individual states in the South • Again, we will use the GT-NEMS tax scenarios ($10, $15, $20 and$25/metric tons of CO2 tax starting in 2018 and applied only to electric power sector) • We are developing a method to apportion NEMS-modeled CO2 emissions reductions for NERC regions to states in the South
Two Key Factors to Consider: “Motivation” and “Means” • We ask the following question: • “How much of a NERC region’s CO2 abatement (as modeled in GT-NEMS) is likely to come from each state in the region?” • Two factors are likely to be associated with a state that drives regional emissions reductions • “Motivation” – how much the state in question must reduce in order to meet its 111(d) goals • “Means” – how much “reduction capability” a state has in the region • for example, states without fossil fueled generation in the region are not likely to contribute to a NERC region’s carbon abatement
SERC-TV (OR SRCE) As an Example • We compute the shares of SERC-TV fossil-fueled generation held by each state • We compute the relative “distance-to-goal” for each state • We combine these two metrics to form weights for apportioning SERC-TV CO2 emissions to the constituent states SRCE aka SERC-TV
Step 1: Tally up the fossil-fueled EGUs in each State of SERC-TV We use EIA 860 data to compute the shares of SERC-TV fossil-fuel-fired plants located in each state (includes non-utility EGUs and non-TVA-owned EGUs)
Step 2: Compute the Relative Distance-to-Goal of all SERC-TV states • We take the difference between each state’s final goal and their 2012 emissions rate and • 1. Sum the differences • 2. Compute each difference as a portion of the sum Final Goals from EPA Preamble 2012 Rate from EIA data
Step 3: Apply the Step 1 Weights to the Step 2 Weights • Take the sumproduct of each set of weights, ∑(Step 1 X Step 2) • Then, divide the product of each state’s weights by this sumproduct to get the relative contribution to CO2 emissions reductions States with a large share of fossil-fuelgeneration in the region and a large distance-to-goal have more CO2abatement attributed to them
Questions for Stakeholders • Does this apportioning seem reasonable? • Do you think our GT-NEMS modeling results will be useful? • We will review our proposed method with EPA…anyone else?
Next Steps for FEPS • Finalize white paper and presentation for 9/26 workshop on “Shaping the Southeast’s Energy Future” • Continue to develop our regional analysis • Finalize approach to modeling state 111(d) compliance costs and options in the South and produce preliminary state-level results • Next webinar on Friday, October 17 at 2 pm
For More Information Professor Marilyn A. Brown School of Public Policy Georgia Institute of Technology Atlanta, GA 30332-0345 Marilyn.Brown@pubpolicy.gatech.edu Climate and Energy Policy Lab: http://www.cepl.gatech.edu ResearchAssistants: Gyungwon Kim joykim@gatech.edu Alexander Smith asmith313@gatech.edu