Download
1 / 15
150 likes | 450 Views
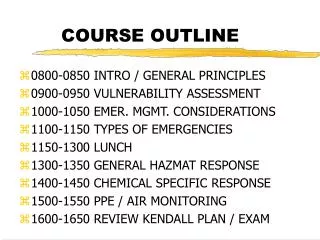
Honduras: Vulnerability assessment vs. Vulnerability post-hoc analysis. Tom Downing and Gina Ziervogel Stockholm Environment Institute. Outline. Hondurus: Hurricane Mitch Vulnerability assessments Pre-disaster vulnerability assessments DIPECHO World Bank Oxfam Post-disaster assessment.

E N D
Honduras:Vulnerability assessment vs. Vulnerability post-hoc analysis Tom Downing and Gina Ziervogel Stockholm Environment Institute
Outline • Hondurus: Hurricane Mitch • Vulnerability assessments • Pre-disaster vulnerability assessments • DIPECHO • World Bank • Oxfam • Post-disaster assessment
Hondurus • ‘Vulnerable’ country • Exposure to floods and seismic activity • How is its vulnerability measured? • Risk mapping tools • How do they compare to what actually happens?
Risk mapping • Identifying vulnerable regions • Regional • National • Local • Mapping • Overlaying different indicators • Combining indicators to reach an index
DIPECHO with CRED and CIFEG • Project aim • Regional approach to disaster preparedness • ‘determine risk levels in the region, taking into account natural dangers and vulnerability criteria.’
DIPECHO methods Reports • CRED, CIFEG, DHA, IDNDR and other local and European universities Indicators for hazards • Frequency and distribution of disasters • Number of people affected • Geological and climatological data • Vulnerability indicators • Economic loss Maps to show results
OXFAM Project aim • To develop a tool not for disaster experts but for local experts Objectives • To assess risks, vulnerability and local capacity at a regional level and adapted for local-level application • To develop the capacity of institutions to tackle emergencysituations
OXFAM methods • Analysis of threats: incidence and distribution • Natural • Human agency • Analysis of vulnerability • Relationship between level of risk, local capacities and living conditions of local communities • Analysis of local capacity • documented in risk map
World Bank with UNEP and CIAT Project aim • To decide where mitigation and reconstruction projects should focus Methods Four layers of maps of vulnerability indices and indicators • Environmental • Population • Social • Infrastructure
World Bank Risk Map LEGEND Red = Top ten high risk municipalities Orange = 10-25 Yellow = 25-60 Risk Map of Honduras – Top 60 High Risk Municipalities
Hondurus: Hurricane Mitch • October 1998 • 6000 dead • Damage primarily from landslides and flooding
Pre and post vulnerability comparison • Pre-Mitch: Oxfam/World Bank • Most vulnerable on west coast • Post-Mitch: World Neighbors/Morris et al • Most vulnerable on east coast and southern watershed
Other indicators • Accessibility – World Bank • Important for reaching affected • Land use – World Neighbors • Sustainable farms faired better • Capacity • Community disaster preparedness • Gender • Lower health and educational status • Harder to recover
Lessons learned • Vulnerability is a complex concept • Capturing the dynamics of specific vulnerabilities is not easy • Is vulnerability mapping a useful tool?