
Bias Assessment of the Single Tube Method (ASTM E2871-12)
Bias assessment is crucial for accurate disinfectant testing results. Learn how the Single Tube Method (STM) is employed to detect bias in disinfectant efficacy testing. Visualization techniques like microscopy and crystal violet assay help identify biased log reductions due to differential biofilm removal. This study highlights the significance of unbiased results in biofilm disinfectant testing, aiding laboratories in ensuring the validity of log reduction outcomes for product testing. Industrial relevance lies in aligning with EPA guidelines for product registration with a biofilm claim, emphasizing unbiased and reproducible test results.

Bias Assessment of the Single Tube Method (ASTM E2871-12)
E N D
Presentation Transcript
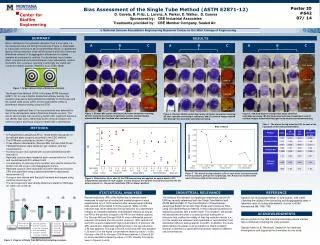
Poster ID #642 07/ 14 Bias Assessment of the Single Tube Method (ASTM E2871-12) D. Goveia, B. Fritz, L. Lorenz, A. Parker, D. Walker, D. Goeres Sponsored by: CBE Industrial Associates Treatments provided by: CBE Member Company, Sealed Air SUMMARY RESULTS Bias is defined as the systematic deviation from atrue value, i.e., the measured value not hitting the bulls eye (Figure 1). Bias leads to inaccurate conclusions about experimental results. In disinfectant testing, the log reduction value will be biased if and only if there are differential removal or disaggregation efficiencies for treated samples as compared to controls. If a disinfectant has a fixative effect, conventional removal techniques may inadequately remove the biofilm from a surface, resulting in artificially low viable cell counts for treated coupons (Hamilton et al. JOAC 2009). Figure 1. Target representation of biased vs. unbiased. The Single Tube Method (STM) is the latest ASTM Standard (E2871-12) for use in biofilm disinfectant efficacy testing. Our research goal was to demonstrate the feasibility of microscopy and the crystal violet assay (CRV) for the assessment of bias in disinfectant efficacy testing using the STM. Statistically significant bias in the log reductions was detected for two of the disinfectants tested (Statistical Analysis section). The results demonstrate that visualizing biofilm after treatment exposure can identify bias due to differential biofilm removal between the control coupons and those coupons treated with a disinfectant. A B C A B C A B C 1.25X Control 1.25X 1:10 1.25X Control Biased Unbiased 1.25X 1:100 1.25X 1:10 METHODS 1.25X 1:800 1.25X 1:100 • A Pseudomonas aeruginosa ATCC 15442 biofilm was grown on borosilicate glass coupons according to the CDC method • The STM was conducted as shown in Figure 2 • Three different disinfectants (Divosan MH, Divosan OSA-N and TSA Acid Sanitizer) were tested at high, medium, and low concentrations • A control coupon was stained with crystal violet before biofilm removal (1) • Replicate coupons were treated at each concentration for 10 min and neutralized with 2X Letheen broth • A combination of vortexing and sonication was used to remove the biofilm from the coupon and disaggregate clumps • Replicate coupons were evaluated for biofilm removal using the CRV and quantified using a spectrophotometric absorbance measurement (2) • A coupon was stained with BacLight live/dead and imaged using confocal microscopy (2) • The cell suspension was serially diluted and plated on R2A agar for viable cell counts (3) Figure 5. TSA Acid Sanitizer crystal violet assay (A) before sonication/vortexing; (B) after sonication/vortexing (3 replicates); and (C) confocal images stained with BacLight live/dead after sonication/vortexing. Table 1. The bias of the log reduction (LR) for each of the 3 products at their test concentrations. 1.25X 1:1000 Figure 3. Divosan MH crystal violet assay (A) before sonication/vortexing; (B) after sonication/vortexing (3 replicates); and (C) confocal images stained with BacLight live/dead after sonication/vortexing. 1.25X Control Figure 7. The bias of the log reduction (LR) for each of the 3 products tested. For all 3 products, perhaps not surprisingly, the LR bias was smallest at the least efficacious disinfectant concentration. Figure 2. Diagram of Single Tube Method and sampling procedure. Figure 6. Either before (B) or after (A) the STM removal step was applied, an optical density (OD) measurement was taken of each coupon. In every instance, the OD after removal was less than the OD before removal (i.e., the percent reductions (PR) are always positive). 1.25X 1:10 REFERENCE 1.25X 1:25 (1) (2) (3) Hamilton, M., Buckingham-Meyer, K. and Goeres, D.M. 2009. Checking the validity of the harvesting and disaggregating steps in laboratory tests of surface disinfectants. Journal of AOAC International. 92: 1755-1762. STATISTICAL ANALYSIS INDUSTRIAL RELEVANCE The timing of this research is of particular importance, as the US EPA has recently referenced both the Single Tube Method and ASTM Method 2562-12 The Quantification of Pseudomonas aeruginosa Biofilm Grown with High Shear and Continuous Flow using CDC Biofilm Reactor Method in their proposed guidelines for registering products with a biofilm claim. This research will provide the laboratories who plan to conduct product testing with a reference that justifies the validity of their log reduction results (i.e., that the results are unbiased (and repeatable or reproducible)) from disinfectant efficacy testing specific to biofilm. In addition, this study demonstrates the power of using statistics to clearly establish whether a treatment is significantly biased with respect to different use concentrations. Percent reductions (PR) of the biofilm due to removal were measured for each set of control and treated coupons in each experimental run. A 100% reduction after removal would indicate total removal of the biofilm from the coupons. While a 100% reduction was never observed, the log reduction for a disinfectant remains an unbiased estimator of disinfectant efficacy as long as the PR for the controls is equal to the PR fro the treated coupons. For Divosan MH and Divosan OSA-N, due to differential percent reduction of bacteria from the control coupons (~90% reductions) and from coupons treated with high concentrations of products (45-60% reductions), statistically significant bias in the log reductions (LR) was detected. The bias in the LR for Divosan MH was between 0.25 and 0.3 for the higher concentrations tested (p-value < 0.001); the bias in the LR for Divosan OSA-N was between 0.18 and 0.25 for all concentrations tested (p-value = 0.029. Visually, this can be seen in Figures 3 and 4. 1.25X 1:50 ACKNOWLEDGMENTS Figure 4. Divosan OSA-N crystal violet assay (A) before sonication/vortexing; (B) after sonication/vortexing (3 replicates); and (C) confocal images stained with BacLight live/dead after sonication/vortexing. We are grateful to the CBE Industrial Associates whose member fees contributed to making this study possible. Special thanks to B. Glembocki, Sealed Air, for initial bias investigations and supplying the chemistries for this study.


