Download
1 / 24
240 likes | 278 Views
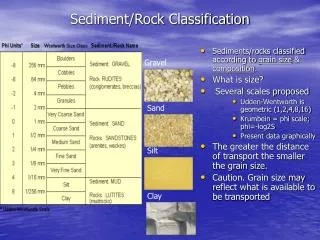
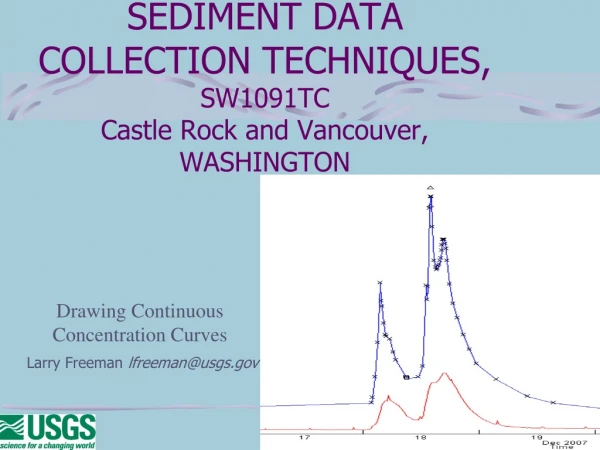
Learn how to draw concentration curves using water discharge and sample concentrations. Follow principles for peak concentration, storm curves, and analyzing sediment data effectively.

E N D
SEDIMENT DATA COLLECTION TECHNIQUES,SW1091TC Castle Rock and Vancouver, WASHINGTON Larry Freeman lfreeman@usgs.gov Drawing Continuous Concentration Curves
To Draw a Concentration curve, you need to: • Plot samples on a time-series graph of water discharge or gage height. • Plot individual sample concentrations vs. water discharge on log scale. • Be open minded. Don’t bring assumptions into the process. • Sediment does not always do what we expect.
GENERAL PRINCIPLES FOR DRAWING CONCENTRATION CURVES LOTS TO THINK ABOUT
SLOPE OF CONCENTRATION CHANGE IS USUALLY STEEPER ON THE RISING LIMBTHAN ON THE RECESSION.
Principle #1.Slope of concentration is usually steeper on the rising limb than on the recession.
2. CONCENTRATION USUALLY INCREASES AT A SLOWER RATE THAN GAGE-HEIGHT AT THE ONSET OF A STORM RISE.
Principle #2.Concentration usually increases at a slower rate than gage height at the onset of a storm rise.
3. CONCENTRATION VERY OFTEN PEAKS AT FIRST BREAK IN SLOPE OF THE STORMHYDROGRAPH.
Principle #3.CONCENTRATION VERY OFTEN PEAKS AT FIRST BREAK IN SLOPE OF THE STORMHYDROGRAPH.
4. RISINGCONCENTRATION SLOPE IS STEEPEST DURING MOST INTENSE RAINFALL
5. CONCENTRATION SEDIGRAPH PEAKS FOR SNOWMELT ARE MORE GENTLE THAN FORRAIN.
6. CONCENTRATION PEAKS OF SMALL MOUNTAIN STREAMS OFTEN OCCUR AT ORBEFORE STORM DISCHARGE PEAKS.
7. DRAW TEMPORAL CONCENTRATION CURVE THROUGH SAMPLES STARTING DURING THEPERIOD WITH THE MOST SAMPLE DATA.
8. DRAWING THE STORM CURVE: • Draw the recession curve first (usually have better sample coverage) • Draw the rising limb next • Estimate unsampled peak concentrations using a transport curve • Last, smooth out transition between the rising limb, peak and falling limb of the sedigraph.
9. AVOID EXTRAPOLATING PEAK CONCENTRATION ESTIMATES TOO FAR ABOVESAMPLES.
Gage Height Sample Concentration
10. IF THE FLOW IS VERY HIGH, BUT SAMPLE CONCENTRATION DECREASES OR LEVELS OFF, LOOK FOR:
-MULTIPLE CONCENTRATION PEAKS CAUSED BY SEDIMENT SUPPLY DEPLETION;
-OR OTHER SPECIAL CASES: • Reservoirsupstream causing low concentrations at high flows, or lagging concentration peaks due to travel time of fine sediment through the reservoir. • Confluence of rivers causing dilution or poor mixing.
11. EXAMINE CURVES DRAWN FOR PREVIOUS STORMS AND PREVIOUS YEARS.
12. LAST PRINCIPLE IS THAT THERE ARE NO FIXED RULES.LET YOUR DATA TELL THE STORY
BLANK SLIDE INSERTED INTENTIONALLY SO THAT YOU HAVE SOMETHING TO LOOK AT WHILE I TELL YOU WHAT’S NEXT.