Data Collection & Sampling Techniques
Understand data collection, sampling factors, basic methods, and observational vs. experimental studies for informed statistical analysis.


Data Collection & Sampling Techniques
E N D
Presentation Transcript
Data Collection & Sampling Techniques Algebra II Honors Statistics Unit
Sampling… What is your population of interest? • To whom do you want to generalize your results? • All doctors • School children • Native Americans • Women aged 15-45 years • Other Can you sample the entire population?
Sampling… • Factors that influence sampling • Sample size • Sampling procedure • Participation • When might you sample the entire population? • When your population is very small • When you have extensive resources • When you don’t expect a very high response
Terms • Population refers to the collection of people, animals, locations, items etc. with a characteristic the study wishes to understand. • A data sample is a set of data collected and/or selected from a statistical population.
Objectives • Identify the six basic sample techniques
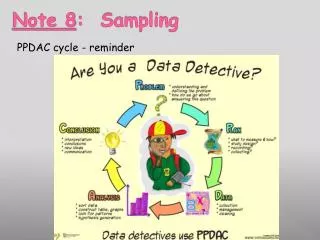
Data Collection • In research, statisticians use data in many different ways. • Data can be used to describe situations. • Data can be collected in a variety of ways, BUTif the sample data is not collected in an appropriate way, the data may be so completely useless that no amount of statistical torturing can salvage them.
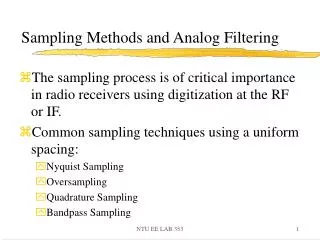
Basic Methods of Sampling • Simple Random Sampling • Each individual in the population is chosen completely by chance and has an equal chance of being selected • Each individual subject (human or otherwise) has an equal chance of being selected • Examples: • Drawing names from a hat • Random Numbers • Lottery System
Basic Methods of Sampling • Simple Random Sampling • Applicable when population is small, homogeneous & readily available • Advantages – easy to calculate • Disadvantages – If sampling a large population, this method could be deemed impractical
Basic Methods of Sampling • Systematic Sampling • Members of the sample are chosen according to a rule, such as the nth individual in the population • Select a random starting point and then select every nth subject in the population • Advantage: sample is easy to select and & evenly spread out over the entire population
Basic Methods of Sampling • Convenience Sampling • Individuals are selected based on how accessible they are • Examples: • Using family members or students in a classroom • Mall shoppers
Basic Methods of Sampling • Convenience Sampling • The researcher using such a sample cannot scientifically make generalizations about the total population from this sample because it would not be representative enough. • For example, if the interviewer was to conduct a survey at a shopping center early in the morning on a given day, the people that he/she could interview would be limited to those given there at that given time, which would not represent the views of other members of society in such an area, if the survey was to be conducted at different times of day and several times per week. • This type of sampling is most useful for pilot testing
Basic Methods of Sampling • Stratified Sampling • Divide the population into at least two different groups with common characteristic(s), then draw SOME subjects from each group (group is called strata or stratum). Generally items from each group are selected through a simple random sample.
Basic Methods of Sampling • Cluster Sampling • Divide the population into groups (called clusters), randomly select some of the groups, and then collect data from ALL members of the selected groups • Population divided into clusters of homogeneous units, usually based on geographical contiguity. • Used extensively by government and private research organizations • Examples: • Exit Polls
Difference between Strata and Clusters • Although strata and clusters are both non-overlapping small groups of the population, they differ in several ways. • All strata are represented in the sample; but only small group of clusters are in the sample. • With stratified sampling, the best survey results occur when elements within strata are internally homogeneous. However, with cluster sampling, the best results occur when elements within clusters are internally heterogeneous.
Basic Methods of Sampling • Self Selected Sampling • Individuals volunteer to be part of the sample. • self-selection bias arises in any situation in which individuals select themselves into a group, causing a biased sample
Observational and Experimental Studies Section 1-5
Objectives • Explain the difference between an observational and an experimental study
Types of Experiments • Observational Studies • The researcher merely observes what is happening or what has happened in the past and tries to draw conclusions based on these observations • No interaction with subjects, usually • No modifications on subjects • Occur in natural settings, usually • Can be expensive and time consuming • Example: • Surveys---telephone, mailed questionnaire, personal interview
Types of Experiments • Experimental Studies • The researcher manipulates one of the variables and tries to determine how the manipulation influences other variables • Interaction with subject occurs, usually • Modifications on subject occurs • May occur in unnatural settings (labs or classrooms) • Example: • Clinical trials of new medications ,treatments, etc.
Uses and Misuses of Statistics Section 1-6
Objectives • Explain how statistics can be used and misused
Uses of Statistics • Describe data • Compare two or more data sets • Determine if a relationship exists between variables • Test hypothesis (educated guess) • Make estimates about population characteristics • Predict past or future behavior of data Use of statistics can be impressive to employers.
Sources of Misuse • There are two main sources of misuse of statistics: • Evil intent on part of a dishonest researcher • Unintentional errors (stupidity) on part of a researcher who does not know any better • Almost all fields of human endeavor benefit from the application of statistical method; however, the misuses of statistics are just as abundant, if not more so!
Misuses of Statistics • Samples • Voluntary-response sample (or self-selected sample) • One in which the subjects themselves decide whether to be included---creates built-in bias • Telephone call-in polls (radio) • Mail-in polls • Internet polls • Small Samples • Too few subjects used • Convenience • Not representative since subjects can be easily accessed
Misuses of Statistics • Graphs • Can be drawn inappropriately leading to false conclusions • Watch the “scales” • Omission of labels or units on the axes • Exaggeration of one-dimensional increase by using a two-dimensional graph
Misuses of Statistics • Survey Questions • Loaded Questions---unintentional wording to elicit a desired response • Order of Questions • Nonresponse (Refusal)—subject refuses to answer questions • Self-Interest ---Sponsor of the survey could enjoy monetary gains from the results
Misuses of Statistics • Missing Data (Partial Pictures) • Detached Statistics ---no comparison is made • Percentages -- • Precise Numbers • People believe this implies accuracy • Implied Connections • Correlation and Causality –when we find a statistical association between two variables, we cannot conclude that one of the variables is the cause of (or directly affects) the other variable