Download
1 / 4
40 likes | 156 Views
This document outlines creative strategies for summarizing and evaluating clustering outcomes. The primary focus is on summarization techniques to analyze the contents of each cluster, while the secondary focus emphasizes post-analysis evaluation methods. Suggestions include utilizing box plots to compare cluster distributions with the overall dataset, generating interestingness scores based on deviation properties, and using decision trees for cluster quality assessment. The aim is to enhance understanding of cluster similarities and differences through statistical summaries and evaluation measures.

E N D
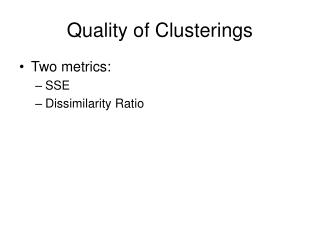
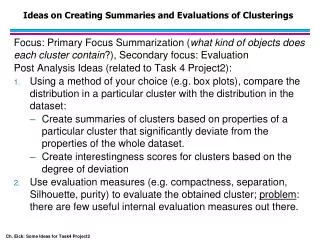
Ideas on Creating Summaries and Evaluations of Clusterings Focus: Primary Focus Summarization (what kind of objects does each cluster contain?), Secondary focus: Evaluation Post Analysis Ideas (related to Task 4 Project2): • Using a method of your choice (e.g. box plots), compare the distribution in a particular cluster with the distribution in the dataset: • Create summaries of clusters based on properties of a particular cluster that significantly deviate from the properties of the whole dataset. • Create interestingness scores for clusters based on the degree of deviation • Use evaluation measures (e.g. compactness, separation, Silhouette, purity) to evaluate the obtained cluster; problem: there are few useful internal evaluation measures out there.
Ideas on Creating Summaries and Evaluations of Clusterings II More Post Analysis Ideas: • Learn a decision tree (some other model) that separates the instances of a particular cluster from the instances of the other 4 clusters • Use the accuracy of the decision tree as a measure for the quality of a cluster • Use a highly pruned version of the decision tree as a summary of the decision tree (or rules derived from a decision tree; e.g. report all paths that lead to choose the class of cluster as a set of rules) • … • Using a method of your choice (e.g. box plots), compare the distribution of pairs of clusters: • Analyze which clusters are similar to each other and which deviate from each other. • Summarize the patterns they have in common and the patterns in which they differ. • …
Example1: Using Box Plot Cluster Summaries • Compute the interquartile range (IQR) for each attribute for the dataset and for each cluster. • Compute the overlap of each cluster box plot with the dataset boxplot. Let (a,b) be the cluster IQR with a>b and (a’,b’) the dataset IQR with a’>b’ for attribute att; then: att=max(0, min(a’,a)-max(b’,b)) / (max(a’,a)-min(b’,b))) • Discard cluster box plot for att if att>th (e.g. th=0.7) • Use the surviving boxplots as cluster summary for the clusters also reporting for all clusters (including the discarded ones) • Compute cluster interestingness as follows: Let O= {1,…, r} be the overlap of a cluster c for its r attributes; in in general, Interestingness(c)=f(O); e.g. f(O)=average(O.values) Let v1, v2, v3 the lowest, second lowest, and third lowest value in O: Interestingness(O)=1- ((v1*3+v2*2+v3*1)/6)