Download
1 / 16
160 likes | 175 Views
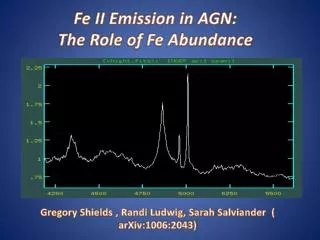
This study examines the Fe II emission lines in AGN spectra, including the construction of an Fe II template and analysis of the ratios of Fe II line groups with other spectral properties. The study also explores the correlation between EW [O III] and EW Fe II, known as the Baldwin effect.

E N D
The Fe II lines in AGN spectra Jelena Kovačević1, Luka Č. Popović1 and Milan S. Dimitrijević1 1Astronomical Observatory Volgina 7, 11060 Belgrade, Serbia
Cen A Fe II
Outline • The Fe II lines – what makes them interesting? • The sample selection • Analysis • Results: 1. The Fe II template 2. The ratios of Fe II line groups vs. other spectral properties 3. EW [O III] – EW Fe II anticorrelation and Baldwin effect
The Fe II lines – what makes them interesting? • Many unresolved problems: • Identification of the optical Fe II lines in λλ4400 -5500 Å range, • Theoretical calculation of their intensities, • geometrical place of the Fe II emission region in AGN structure, • many unexplained correlations between Fe II line properties and other lines (for example EW Fe II – EW [O III] anticorrelation) • etc. Fe II (λλ4400 -5500 Å) Hβ [O III] Intensity Fe II Fe II Wavelength (A) I Zw 1 object
The sample selection In order to investigate the Fe II emission lines, we selected the sample of AGN spectra from SDSS DR7, using an SQL search. (http://cas.sdss.org/dr6/en/tools/search/sql.asp).
The sample selection SELECT SpecObj.plate, SpecObj.mjd, SpecObj.fiberID FROM SpecObj JOIN SpecLine as L1 ON SpecObj.SpecObjID = L1.SpecObjID JOIN SpecLine as L2 ON SpecObj.SpecObjID = L2.SpecObjID JOIN SpecLine as L3 ON SpecObj.SpecObjID = L3.SpecObjID JOIN SpecLine as L4 ON SpecObj.SpecObjID = L4.SpecObjID JOIN SpecLine as L5 ON SpecObj.SpecObjID = L5.SpecObjID JOIN SpecLineNames as LN1 ON L1.LineId = LN1. value JOIN SpecLineNames as LN2 ON L2.LineId = LN2.value JOIN SpecLineNames as LN3 ON L3.LineId = LN3.value JOIN SpecLineNames as LN4 ON L4.LineId = LN4.value JOIN SpecLineNames as LN5 ON L5.LineId = LN5.value WHERE LN1.name = 'OIII_5008' and LN2.name = 'Hb_4863' and LN3.name = 'K_3935' and LN4.name = 'Mg_5177' and LN5.name = 'Hd_4103' and L1.ew > 0 and L2.ew > 0 and L3.ew > -1 and L4.ew > -1 and L5.ew > -1 AND SpecObj.z between 0.0 and 0.7 and SpecObj.zConf > 0.95 and SpecObj.sn_0>20 and (specObj.specClass = 2 OR specObj.specClass = 3 OR specObj.specClass =4) • SDSS DR7 contains spectra • of 1.6 million objects: • - 930 000 galaxies • - 120 000 QSO • - 460 000 stars • Using SQL search, we • choose 302 AGN spectra • as the best sample for our • investigation of the • Fe II lines.
Analysis • We fitted the considered emission spectral lines ([O III], Hβ, [N II], Hα) with summ of Gaussians, • Fe II lines are fitted with calculated template, • χ2minimalization routine is used, for obtaining the best fit.
Results: 1. The Fe II template • To investigate the Fe II emission, we made an Fe II template, taking into account following: (a) majority of Fe II multiplets dominant in λλ4400 -5500 Å range, have one of three specific lower terms of their transitions: 3d6 (3F2)4s 4F, 3d5 4s26S or 3d6 (3G)4s 4G (hereinafter F, S and G groups of lines), (b) beside these lines there are also lines whose origin is not well known, and probably originate from higher levels
Results: 1. The Fe II template The constructed Fe II template consists of: • 35 lines, which describe 75% of Fe II emission in λλ4400 -5500 Å range, and belong toF, S or G group. These line groups approximately correspond to the blue, central and red part of the Fe II shelf. The relative intensities of lines within one line group are calculated using the formula: • 15 lines, which probably originate from higher levels, and make about 25% of the Fe II emission. Their relative intensities are taken from I Zw 1 object (I Zw 1 group).
Results: 1. The Fe II template • The template is described with 7 free parameters: - 4 parameters of intensity - for Fe II lines from F, S and G line groups and for I Zw 1 group, - one parameter of the width and one of the shift (since we assume that all iron lines have the same width and shift), - excitation temperature;
Kovačević et al. 2010 Kovačević et al. 2010 Veron-Cetty et al. 2004 This template enables more precise fit than others, specially in the cases where there is a big discrepancy between the intensities of the red and the blue iron shelf (F and G line groups). Veron-Cetty et al. 2004 Bruhweiler and Verner 2008 Bruhweiler and Verner 2008
Results: 2. The ratios of Fe II line groups vs. other spectral properties • The ratios of Fe II line groups (F/S, F/G and G/S) vary in different objects: • Since the ratios of line intensities are indicators of physical properties of the plasma where those lines arise, we have investigated relations among the ratios of Fe II line groups (F/S, F/G and G/S) and various spectral properties (FWHM Hβ, continuum luminosity L5100, LHα/LHβ ratio…).
We preformed correlations for the total sample, and for the subsamples divided according to FWHM Hβ, and denoted as: (1) for FWHM Hβ < 3000 km/s and (2) for FWHM Hβ > 3000 km/s.
Results: 3. EW [O III] – EW Fe II anticorrelation and Baldwin effect • EW [O III] vs. EW Fe II anticorrelation related to EV 1 (Boroson and Green 1992) – physical origin – not understood! • To understand the EW [O III] vs. EW Fe II anticorrelation, we examined its relationship to continuum luminosity and redshift; β
Results: 3. EW [O III] – EW Fe II anticorrelation and Baldwin effect • EW [O III] vs. EW Fe II • anticorrelation – redshift and luminosity dependant! • - Fe II lines show Inverse Baldwin effect (Baldwin 1977), while [OIII] lines show Baldwin effect – this implies the connection ofEW [O III] vs. EW Fe II anticorrelation (EV1) and Baldwin effect!
Conclusions 1. Proposed Fe II template enables more precise fit than other Fe II templates. It also enables analysis of different groups of Fe II transitions, which contribute to the blue, central and red part of Fe II shelf. 2. We find that the ratios of different parts of the iron shelf (F/G, F/S, and G/S) depend of some spectral properties such as: continuum luminosity, Hβ FWHM, shift of Fe II, and Hα/Hβ flux ratio. 3. The observed EW Fe II vs. EW [O III] anti-correlation is probably due to the same physical reason which causes the Baldwin effect. 4. The sub-samples with FWHM Hβ < 3000 km/s and FWHM Hβ > 3000 km/s, have different spectral properties, which reflex in significantly different coefficients of some correlations. Kovačević, J., Popović L.Č. and Dimitrijević M.S., ApJS accepted, 2010arXiv1004.2212K

![[Fe II ] 1.64 m m](https://cdn1.slideserve.com/3423313/slide1-dt.jpg)