Download
1 / 25
250 likes | 370 Views
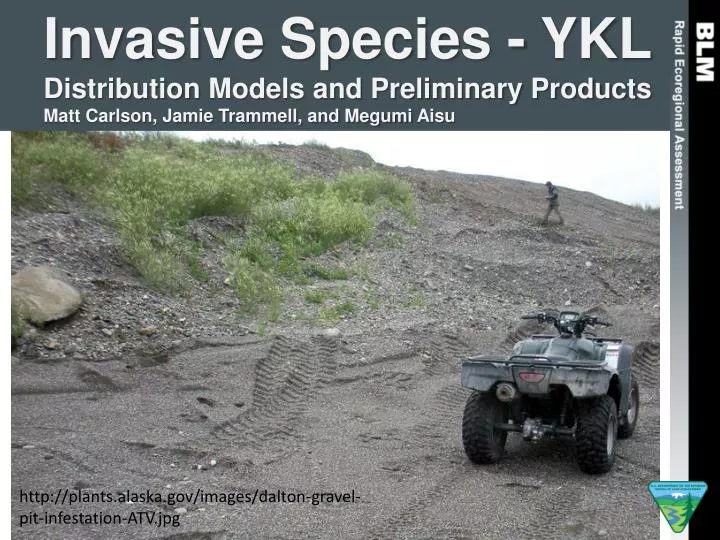
Invasive Species - YKL Distribution Models and Preliminary Products Matt Carlson, Jamie Trammell, and Megumi Aisu. http://plants.alaska.gov/images/dalton-gravel-pit-infestation-ATV.jpg. Approach to Invasives. Invasive Species are treated as a Change Agent in all REAs

E N D
Invasive Species - YKL Distribution Models and Preliminary Products Matt Carlson, Jamie Trammell, and Megumi Aisu http://plants.alaska.gov/images/dalton-gravel-pit-infestation-ATV.jpg
Approach to Invasives • Invasive Species are treated as a Change Agent in all REAs • Current levels of infestation in YKL are low • Problems with invasive species are increasing in the state • Management decisions today will impact future composition of systems Non-Native Plants Documented & Established in Native Habitats
Approach to Invasives • Summary of Scope of Invasive Species Management Questions • What is the current distribution and abundance of non-native species in the REA? • Which areas are most susceptible to invasive species currently? • Which areas are most susceptible to invasive species in the future? • What are the likely vectors for non-native species introductions?
What are the likely vectors for non-native species introductions? • Approach: • Literature review • 30 peer-reviewed, 5 reports (few region-specific) • Review of spatial patterns and species in AKEPIC • Products: • Written summary
Approach to Invasives • Invasive Species Vectors Preliminary Summary • Ecological and economic damage from invasive species requires: • Transportation of propagules • Establishment • Expansion to high biomass • Pathways of transportation are predictable • Movements of people and goods • Habitat corridors (roads) • Vast majority of introductions are intentional • Contaminants are an issue for plants in Alaska (straw, agricultural seed, container pots, imported fill) • Regional hubs are the most likely entry points • Weeds will establish in communities prior to natural expansion
Approach to Invasives • Current patterns of plant invasion in YKL match expectations • Greater diversity and number of infestations at hubs • Subset of less invasive, more disturbance specialists in smaller communities • Very few infestations outside of communities
Current Distribution of Invasives? • Infestation data from AKNHP’s statewide non-native plant database (AKEPIC) • Products: • Develop GIS product • Tabular and written descriptions • Preliminary outputs: • 41 plant species • 273 acres infested • Non-native plant occurrences (red circles) are primarily associated with developed areas (white boxes)
Identification of areas susceptible to invasion • Relationship of non-native plant occurrences with environmental and human variables • Non-native plant and environmental/human variables summarized by 4th Level HUC for all Alaska • CART & Random Forest models developed • Important variables and thresholds identified • Predicted “Infestation values” mapped back onto YKL Predicted Species Richnes
Which areas are most susceptible to non-native plant invasion currently and in the future? Non-Native Plant Species Richness by HUC8
Which areas are most susceptible to non-native plant invasion currently and in the future?
Quantifying plant infestations by HUC Non-Native Plant Species Richness Number of Highly Invasive Infestations Infestation Index (not infested vs. infested) • What is our measure of non-native species infestation? • Non-Native Species Richness • Ranges from 0-136 • Greater richness increases the probability of presence of a species that interferes with management decisions (regardless of perceived “invasiveness”) • Somewhat less biased than infested area, number of records etc., by sampling intensity • Correlated with other infestation metrics • Number of Highly Invasive Infestations • Ranges from 0-3400 • This represents conditions least favorable for land managers • Numbers of such infestations are likely partially biased by sampling intensity • Infestation Index • Review of data indicate two primary classifications: HUCs with only minor levels of infestations of weakly invasive species and HUCs with numerous infestations including species considered highly invasive • HUCs with ≥ 20 species almost always have highly invasive populations & splits the data into similar sized pieces Number of Highly Invasive Infestations per HUC Non-Native Plant Species Richness per HUC
Which variables are used to explain infestation levels? • Human Variables (ISER) • Population size • Per capita income • Age of the oldest community in each HUC • Area of timber land • Area of agricultural land • Length of roads • Length of hiking trails • Length of permanent trails • Length of winter trails • Length of unclassified trails • Environmental Variables (SNAP 2010-2019) • Mean annual temperature • Mean January temperature • Mean July temperature • Mean annual precipitation • Mean January precipitation • Mean July precipitation • Mean growing season length • Mean freeze date • Mean thaw date • Permafrost area
Which areas are most susceptible to non-native plant invasion currently and in the future? • Preliminary Results • Non-native species richness • Explained mostly by: • Population size (one major threshold) • Per capita income (one major threshold) • Length of roads (two thresholds) • Environmental Variables • Explain far less of the variation • Variables associate with longer growing season tend to be most important Non-Native Plant Species Richness Unconstrained Regression Tree
Which areas are most susceptible to non-native plant invasion currently and in the future? Preliminary Results Non-native species richness Population Road Density Ann. Temp. Income
Which areas are most susceptible to non-native plant invasion currently and in the future? Preliminary Results Non-native species richness Pruned regression tree
Which areas are most susceptible to non-native plant invasion currently and in the future? • Preliminary Results • Number of Highly Invasive Populations • Explained mostly by: • Population size (two thresholds) • Date of freeze (one threshold) • Annual precipitation • Length of roads Date of Freeze Population Road Density Ann. Precip.
Which areas are most susceptible to non-native plant invasion currently and in the future? • Preliminary Results • Number of Highly Invasive Populations • Pruned regression tree • Basically HUCs without many highly invasive populations are those that have some freezing in winter + human populations of < 25,400 and with per capita incomes < $25,000
Which areas are most susceptible to non-native plant invasion currently and in the future? • Preliminary Results • Infestation Index • Explained mostly by: • Length of roads • Population size • Income • Precipitation
Which areas are most susceptible to non-native plant invasion currently and in the future? • Preliminary Results • Infestation Index • Pruned regression tree • HUCs associated with more roads, or HUCs that do not freeze, or those with high per capita income tend to have some nasty areas
Which areas are most susceptible to non-native plant invasion currently and in the future? Current non-native plant richness by HUC from survey data
Which areas are most susceptible to non-native plant invasion currently? • Preliminary CART Model Predictions • Most of YKL = Low Non-Native Species Richness • (transparent = less than 10 spp.) • McGrath associated HUCs = Moderate Species Richness • (red = > 10 spp.)
Which areas are most susceptible to non-native plant invasion in the future? Model Predictions “Highly Infested” when > 127 km roads & > 522 mm annual precipitation
Which areas are most susceptible to non-native plant invasion currently and in the future?
Which areas are most susceptible to non-native plant invasion currently and in the future? Area susceptible to becoming highly infested is expected to increase in the future
Summary • Infestations are primarily a function of anthropogenic factors • Climate secondarily important • Current model outputs are coarse • Some utility in identifying thresholds and areas of future susceptibility • Questions or Comments? • Matt Carlson • 786-6390 • mlcarlson@uaa.alaska.edu • or Jamie Trammell • 786-4865 • ejtrammell@uaa.alaska.edu Canada thistle – UAF Cooperative Extention