Download
1 / 14
150 likes | 285 Views
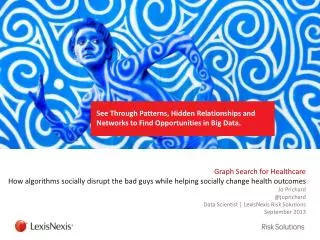
Graph Search for Healthcare How algorithms socially disrupt the bad guys while helping socially change health outcomes Jo Prichard @ joprichard Data Scientist | LexisNexis Risk Solutions September 2013. See Through Patterns, Hidden Relationships and Networks to Find Opportunities in Big Data.

E N D
Graph Search for HealthcareHow algorithms socially disrupt the bad guys while helping socially change health outcomesJo Prichard@joprichardData Scientist | LexisNexis Risk SolutionsSeptember 2013 See Through Patterns, Hidden Relationships and Networks to Find Opportunities in Big Data.
Graph Search for Healthcare • Graph Search vs. Page Rank • Real-time search vs. pre-calculated vertex variables. • Ideal is a combination of both. • Measure the whole graph (Page Rank style) AND search the whole graph (Graph Search style). • HPCC Systems & LexisNexis social graph • Enterprise readyopen-source big data high performance distributed processing platform. • +- 270 million Active Identities, 4 billion people relationships • 24 billion rows in a distributed partitioned graph. • Simple example of a graph calculation • Partition a graph. • JOIN is your friend (when it is distributed and not on a RDBMS!) • LESS CODE, MORE POWER, MORE VALUE! • Case Study Example :Applying graph analysis to measure socialized prescriptions. • Social Graph prescription stats to measure social density. • Case study results. • Transform insights to actionable data. See through Patterns, Hidden Relationships and Networks to find Opportunities in Big Data. 2
Graph Search vs. Page Rank For HealthcareReal-time search vs. pre-calculated vertex variables. • Graph Search Stylefor a single patient • How many of my associates are smokers? • Do I have a licensed medical professional in my social network? • Are most of my associates and their associates getting the flu shot this year? • How many of my associates live near to where I live? • I have a prescription for Vicodin, how many of my associates and their associates also have prescriptions for Vicodin? • How far do my associates travel geographically to fill scheduled drug prescriptions relative to their other prescriptions? • Page Rank Style for all patients • Calculate the answer for every vertex!! • Best of both styles. • Are health outcomes negatively affected if your associates smoke? • Do personal associations with a licensed medical professional impact hospital readmittance rates? • Which elderly or disabled patients are more at risk because they do not live near their support system? • Are there dense social clusters with risk factors for obesity? • How normal is it for you and 15 of your close friends to all be receiving Vicodin prescriptions at the same time and are you all catching a plane from Alabama to Tampa to fill them? Trusted Relationships See through Patterns, Hidden Relationships and Networks to find Opportunities in Big Data. 3
About LexisNexis Risk Solutions • LexisNexis Risk Solutions • A division of Reed Elsevier. • 2012 LexisNexis Risk Solutions Revenue = $1.5 billion • Expanding Healthcare vertical with recent acquisitions in the Healthcare space. • HPCC Systems • High Performance Distributed Processing Platform • Open Source, in Production for more than a decade • Utilizes Commodity Hardware • LexisNexis public data social graph • Relationships inferred from 50TB of Public Records Data. • People connected to people, assets, businesses and more. • +- 270 million Active Identities, 4 billion people relationships, • High Value relationships for Mapping trusted networks. • Examples leveraging LexisNexis social graph. • Healthcare • Medicaid\Medicare Fraud. • Drug Seeking Behavior. • Disease Management and Wellness Programs. • Financial Services. • Mortgage Fraud. • “Bust out” Fraud. • Insurance • Staged Accident Fraud. See through Patterns, Hidden Relationships and Networks to find Opportunities in Big Data. 4
Relationships in a nutshell. No Social Media Data! Trusted Relationships See through Patterns, Hidden Relationships and Networks to find Opportunities in Big Data. 5
Simple graph Vertexes (Nodes) Edges (Links) Trusted Relationships Degree, Type of Relationship, Date Range.. Attributes & Variables Age, Spend, Claim Velocity… Now imagine you have 270 Million Vertexes and 24 Billion Edges. See through Patterns, Hidden Relationships and Networks to find Opportunities in Big Data. 6
Simple example in ECL of a graph calculation in scale import SNA, Person, Healthcare; Edges := Person.Clusters; // a dataset containing centroid to vertexes within 2 degrees. Transactions := Healthcare.PrescriptionTransactions; // prescriptions for people ids. // Distribute both datasets across all nodes and do a distributed join (not indexed) ClusterTransactions := JOIN(Edges, Transactions, left.ToId=right.PersonId, HASH); // Calculate the number of prescription by drug name within 2 degrees of every centroid (person) ClusterStats := TABLE(ClusterTransactions, {FromId, generic_drug_name, prescription_count:= COUNT(GROUP); prescription_1degree_count := COUNT(GROUP, degree <= 1); prescription_2degree_count := COUNT(GROUP, degree > 1 and degree <= 2) }); OUTPUT(ClusterStats(drug_generic_name='HYDROCODONE'), 200, -prescription_count); Top 200 patients within a social network with a high volume of patients receiving vicodin prescriptions. Trusted Relationships It is just a JOIN and an AGGREGATION See through Patterns, Hidden Relationships and Networks to find Opportunities in Big Data. 7
HYDROCODONE CLUSTER KEY INDICATORS • Tight social group of people who appear to be well connected to each other. • Multiple family groups receiving HYDROCODONE. • Cluster Stats put this group socially in the 0.0005% of 1million+ HYDROCODONE prescriptions. • One of the Doctors tied to the HYDROCODONE prescriptions in the cluster is also socially a member of this social group. See through Patterns, Hidden Relationships and Networks to find Opportunities in Big Data. 8
INTERESTING HYDROCODONE CLUSTER Relationships are from public records (non-obvious in the healthcare data domain) Question: Is it normal for you and 15 of your associates to all receive a prescription for vicodin within the same short timespan? • MIKE JONES MD • Is the prescribing doctor who prescribed Vicodin to patients in the target social cluster (James Anderson) • He is a member of the same social cluster • Also personally filled a vicodin prescription for himself. See through Patterns, Hidden Relationships and Networks to find Opportunities in Big Data. 9
SOCIALIZATION OF PRESCRIPTIONS:Social vs Non-Social Drugs Number of prescriptions by social association. • Highlights which drugs show higher levels of socialization. • Highlights outliers and anomalous social patterns • Provides new insight and context at a social drug level. • Not all drugs are created “socially equal”. Almost every prescription is in social isolation (> 96%) Large % of prescriptions show socialization (long tail) KEY 1: Means the number of prescriptions for that drug that are the ONLY prescription of that type within the social group. 2: Means the number of prescriptions for that drug that are within a social group where there is one other member receiving a prescription for that drug. 3: Means the number of prescriptions for that drug that are within a social group where there are two other members receiving a prescription for that drug. And so on… See through Patterns, Hidden Relationships and Networks to find Opportunities in Big Data. 10
SOCIALIZATION OF PRESCRIPTIONS:Social vs Non-Social Drugs INSIGHTS INTO SOCIAL SPREAD OF PRESCRIPTION BRANDS • Understand what is normal per drug. • Detect and highlight social outliers • Develop an exclusion list for legitimately social drugs (e.g. Antibiotics & Vaccines) • At a drug name level measure unusual social spread. • More quickly see unusual drugs patterns socially. • Might indicate recruitment or drug seeking behavior. • Strategically focus on problematic prescription types from a social spread perspective not an individual patient volume perspective. • Within all the claims focus on the smaller subset of those that are too social. See through Patterns, Hidden Relationships and Networks to find Opportunities in Big Data. 11
SOCIALIZATION OF PRESCRIPTIONS:Social Prescription Patterns = Social Health Conditions Number of prescriptions by social association. • identify social clusters with a prescription pattern associated with same health conditions. • Opportunity for strategic social intervention to influence health outcomes. • If you could identify the specific segment of your population that fit this social model, how would you leverage this opportunity? KEY 1: Means the number of prescriptions for that drug that are the ONLY prescription of that type within the social group. 2: Means the number of prescriptions for that drug that are within a social group where there is one other member receiving that prescription drug. 3: Means the number of prescriptions of that drug that are within a social group where there are two other members receiving that prescription drug. And so on… See through Patterns, Hidden Relationships and Networks to find Opportunities in Big Data. 12
SOCIALIZATION OF PRESCRIPTIONS:Mapping the spread and density of social prescriptions VARIABLES THAT FOCUS ON CROWDSOURCING PRESCRIPTIONS • Identify patient social groups with abnormal prescription densities. • Identify prescriberswith unusual social prescription patterns to social groups. • patients see them as an easy source of prescriptions? • Doctors that are more free with prescriptions for family and friends? • Sign of a larger fraud scheme? • Identify specific areas in the graph where there is an opportunity for social disruption. • Dense social clusters with similar health issues e.g. obesity, diabetes Trusted Relationships See through Patterns, Hidden Relationships and Networks to find Opportunities in Big Data. 13 13
In Summary Benefits of Graph Analysis in Scale for Healthcare • Extremely rich source of new perspectives and insight. • Value in cross domain data in scale (you have to have the data, and we do). • Straightforward to roll your own with the new breed of high performance distributed big data processing systems. • Opportunities to disrupt healthcare networks • Change healthcare outcomes. • Tackle organized fraud networks in scale. • 30 mins is too short for this topic! • Jo.Prichard@lexisnexis.com • @joprichard Trusted Relationships See through Patterns, Hidden Relationships and Networks to find Opportunities in Big Data. 14 14