Download
1 / 1
10 likes | 196 Views
Tim Hulsen 1 , Wilco W.M. Fleuren 1 , Peter M.A. Groenen 2 1 CMBI, Radboud University Nijmegen Medical Centre, Nijmegen 2 MDI, Organon NV, Oss. Evolution of the immune system from model organism to man. Introduction

E N D
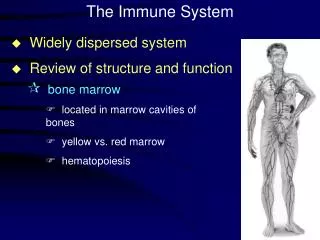
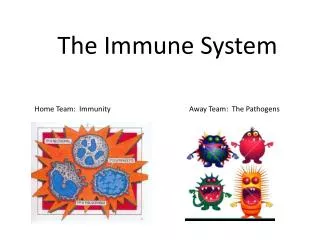
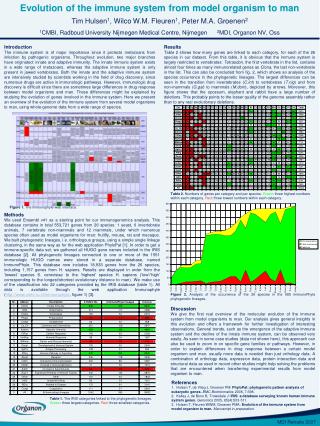
Tim Hulsen1, Wilco W.M. Fleuren1, Peter M.A. Groenen21CMBI, Radboud University Nijmegen Medical Centre, Nijmegen 2MDI, Organon NV, Oss Evolution of the immune system from model organism to man Introduction The immune system is of major importance since it protects metazoans from infection by pathogenic organisms. Throughout evolution, two major branches have originated: innate and adaptive immunity. The innate immune system exists in a wide range of metazoans, whereas the adaptive immune system is only present in jawed vertebrates. Both the innate and the adaptive immune system are intensively studied by scientists working in the field of drug discovery, since numerous drugs are active in immunologic pathways. However, immunologic drug discovery is difficult since there are sometimes large differences in drug response between model organisms and man. These differences might be explained by studying the evolution of genes involved in the immune system. Here we present an overview of the evolution of the immune system from several model organisms to man, using whole-genome data from a wide range of species. Results Table 2 shows how many genes are linked to each category, for each of the 26 species in our dataset. From this table, it is obvious that the immune system is largely restricted to vertebrates: Tetraodon, the first vertebrate in the list, contains almost four times as many immunorelated genes as Ciona, the last non-vertebrate in the list. This can also be concluded from fig. 2, which shows an analysis of the species occurrence in the phylogenetic lineages. The largest differences can be seen in the transition from invertebrates (C.int) to vertebrates (T.nig) and from non-mammals (G.gal) to mammals (M.dom), depicted by arrows. Moreover, this figure shows that the opossum, elephant and rabbit have a large number of deletions. This probably points to the lesser quality of the genome assembly rather than to any real evolutionary deletions. Table 2. Numbers of genes per category and per species. Green: three highest numbers within each category. Red: three lowest numbers within each category. Figure 1. The Immunophyle web interface. Methods We used Ensembl v41 as a starting point for our immunogenomics analysis. This database contains in total 553,721 genes from 26 species: 1 yeast, 6 invertebrate animals, 7 vertebrate non-mammals and 12 mammals, under which numerous species often used as model organisms for man: fruitfly, mouse, rat and macaque. We built phylogenetic lineages, i.e. orthologous groups, using a simple single linkage clustering, in the same way as for the web application PhyloPat [1]. In order to get a immune-specific data set, we gathered all HUGO gene names included in the IRIS database [2]. All phylogenetic lineages connected to one or more of the 1551 immunologic HUGO names were stored in a separate database, named ImmunoPhyle. This database now includes 18,933 genes from the 26 species, including 1,157 genes from H. sapiens. Results are displayed in order from the ‘lowest’ species S. cerevisiae to the ‘highest’ species H. sapiens (‘low’/‘high’ corresponding to the longest/shortest evolutionary distance to man). We make use of the classification into 22 categories provided by the IRIS database (table 1). All data is available through the web application Immunophyle (http://www.cmbi.ru.nl/immunophyle, figure 1) [3]. Figure 2. Analysis of the occurrence of the 26 species in the 585 ImmunoPhyle phylogenetic lineages. Discussion We give the first real overview of the molecular evolution of the immune system from model organisms to man. Our analysis gives general insights in this evolution and offers a framework for further investigation of interesting observations. General trends, such as the emergence of the adaptive immune system and the decline of the innate immune system, can be observed very easily. As seen in some case studies (data not shown here), this approach can also be used to zoom in on specific gene families or pathways. However, in order to explain differences in drug response between a certain model organism and man, usually more data is needed than just orthology data. A combination of orthology data, expression data, protein interaction data and structural data as used in recent other studies might help solving the problems that are encountered when transferring experimental results from model organism to man. References 1. Hulsen T, de Vlieg J, Groenen PM: PhyloPat: phylogenetic pattern analysis of eukaryotic genes.BMC Bioinformatics 2006, 7:398. 2. Kelley J, de Bono B, Trowsdale J: IRIS: a database surveying known human immune system genes.Genomics 2005, 85(4):503-511. 3. Hulsen T, Fleuren WWM, Groenen PMA: Evolution of the immune system from model organism to man.Manuscript in preparation. Table 1. The IRIS categories linked to the phylogenetic lineages. Green: three largest categories. Red: three smallest categories. MDI Retraite 2007