Counting Statistics and Error Prediction
260 likes | 821 Views
Counting Statistics and Error Prediction. Poisson Distribution ( p << 1). Success ≡ Birthday today. p = 1/365. n = 1000. Low cross section. Weak resonance. Short measurement (compared to t 1/2 ). Appendix C. HW 25. We need to know only the product. Asymmetric.

Counting Statistics and Error Prediction
E N D
Presentation Transcript
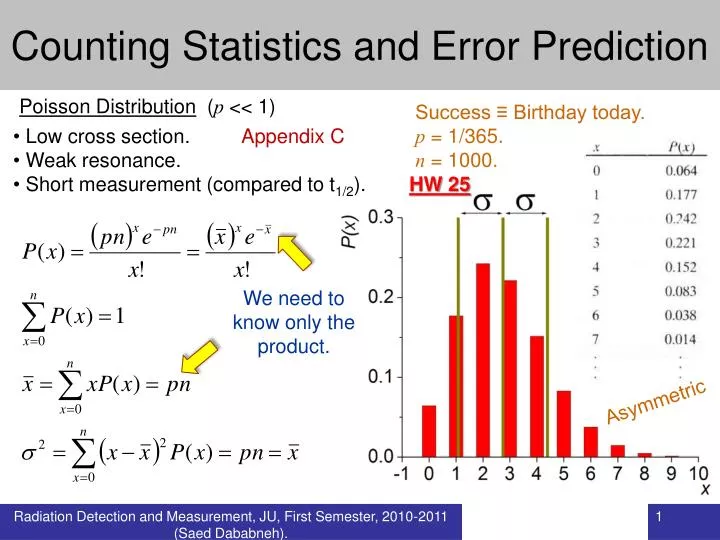
Counting Statistics and Error Prediction Poisson Distribution (p << 1) Success ≡ Birthday today. p = 1/365. n = 1000. • Low cross section. • Weak resonance. • Short measurement (compared to t1/2). Appendix C HW 25 We need to know only the product. Asymmetric Radiation Detection and Measurement, JU, First Semester, 2010-2011 (Saed Dababneh).
Counting Statistics and Error Prediction Gaussian (Normal) Distribution (p << 1, > 20) Success ≡ Birthday today. p = 1/365. n = 10000. HW 26 Symmetric and slowly varying • Can be expressed as a function of . • Can be expressed in a continuous form. Radiation Detection and Measurement, JU, First Semester, 2010-2011 (Saed Dababneh).
Counting Statistics and Error Prediction Radiation Detection and Measurement, JU, First Semester, 2010-2011 (Saed Dababneh).
Counting Statistics and Error Prediction • Calculate the percentage of the samples that will deviate from the mean by less than: • one . • two . • etc … HW 27 Radiation Detection and Measurement, JU, First Semester, 2010-2011 (Saed Dababneh).
Counting Statistics and Error Prediction Total area under the curve above the baseline Baseline offset HW 28 2, approximately 0.849 the width of the peak at half height This model describes a bell-shaped curve like the normal (Gaussian) probability distribution function. The center x0 represents the "mean", while ½ w is the standard deviation. What is FWHM? Resolution? Peak centroid? Radiation Detection and Measurement, JU, First Semester, 2010-2011 (Saed Dababneh).
Counting Statistics and Error Prediction Applications1- Match experiment to model • Assume a specific distribution (Poisson, Gaussian). • Set distribution mean to be equal to experimental mean. • Compare variance to determine if distribution is valid for actual data set (Chi-squared test). and not because we set Radiation Detection and Measurement, JU, First Semester, 2010-2011 (Saed Dababneh).
Counting Statistics and Error Prediction Back to our example • We can’t use Gaussian model for this data set. Why? • Qualitative comparison. • Is 2 close to s2? • Close!? Less fluctuation than predicted! • But quantitatively? • Chi-squared test. HW 29 Only to guide the eye! Radiation Detection and Measurement, JU, First Semester, 2010-2011 (Saed Dababneh).
Counting Statistics and Error Prediction Chi-squared By definition: Thus: or The degree to which c2 differs from (N-1) is a measure of the departure of the data from predictions of the distribution. Radiation Detection and Measurement, JU, First Semester, 2010-2011 (Saed Dababneh).
Counting Statistics and Error Prediction smaller <= Fluctuation => larger Perfect fit 15.891 (interpolation) or http://www.stat.tamu.edu/~west/applets/chisqdemo.html either gives = 0.6646 Conclusion: no abnormal fluctuation. Radiation Detection and Measurement, JU, First Semester, 2010-2011 (Saed Dababneh).
Counting Statistics and Error Prediction Radiation Detection and Measurement, JU, First Semester, 2010-2011 (Saed Dababneh).
Counting Statistics and Error Prediction Single measurement S2 = 2 ≈ x 68% probability that this interval includes the true average value. What if we want 99%..? Fractional standard deviation Need 1%? Count 10000. Radiation Detection and Measurement, JU, First Semester, 2010-2011 (Saed Dababneh).
Counting Statistics and Error Prediction A series of “single” measurements. Radiation Detection and Measurement, JU, First Semester, 2010-2011 (Saed Dababneh).
Counting Statistics and Error Prediction Radiation Detection and Measurement, JU, First Semester, 2010-2011 (Saed Dababneh).
Counting Statistics and Error Prediction • What about derived quantities? (Error propagation). Net counts = Gross counts – Background Compare to addition instead of subtraction. (Count, stop, count). Derived Measured Gross counts = 1000 Background counts = 400 Net counts = 600 37 (not 600 24) Count Rate = ? ? Radiation Detection and Measurement, JU, First Semester, 2010-2011 (Saed Dababneh).
Counting Statistics and Error Prediction Mean value of multiple independent counts. • Assume we record N repeated counts from a single source for equal counting times: • For Poisson or Gaussian distributions: • So that Radiation Detection and Measurement, JU, First Semester, 2010-2011 (Saed Dababneh).
Counting Statistics and Error Prediction Standard error of the mean • To improve statistical precision of a given measurement by a factor of two requires four times the initial counting time. Radiation Detection and Measurement, JU, First Semester, 2010-2011 (Saed Dababneh).
Counting Statistics and Error Prediction Optimizing counting time. How to divide the limited available beam time? S = (net) source count rate. B = background count rate. TS+B = time to count source + background. TB = time to count background. To minimize s : High signal-to-background ratio Low-level radioactivity Weak resonance Very strong background HW 30 Radiation Detection and Measurement, JU, First Semester, 2010-2011 (Saed Dababneh).
Counting Statistics and Error Prediction • Background measurement? • Without the “source”. • Should include all sources except the “source”. • Accelerator applications: background with beam. • Minimum detectable amount. • False positives and false negatives. • Rest of Chapter 3. Radiation Detection and Measurement, JU, First Semester, 2010-2011 (Saed Dababneh).