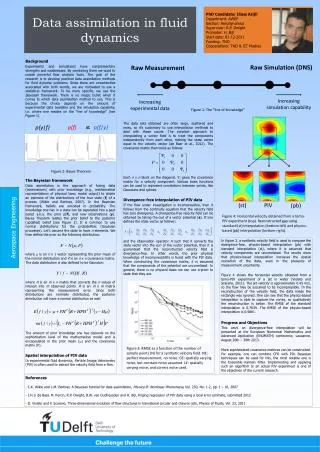
Error statistics in data assimilation
Error statistics in data assimilation. “All models are wrong …” (George Box) “All models are wrong and all observations are inaccurate” (a data assimilator). Ross Bannister NCEO University of Reading, UK, r.n.bannister@reading.ac.uk. Distinction between ‘errors’ and ‘error statistics’.

Error statistics in data assimilation
E N D
Presentation Transcript
Error statistics in data assimilation “All models are wrong …” (George Box) “All models are wrong and all observations are inaccurate” (a data assimilator) Ross Bannister NCEO University of Reading, UK, r.n.bannister@reading.ac.uk
Distinction between ‘errors’ and ‘error statistics’ When people say ‘errors’ they sometimes (but not always) mean ‘error statistics’ Error: The difference between some estimated/measured quantity and its true value. E.g. εest = xest – xtrue or εy = y – ytrue Errors are unknown and unknowable quantities Error Statistics: Some useful measure of the possible values that ε could have. E.g. a PDF Error statistics are knowable, although often difficult to determine – even in the Gaussian case. Here, error statistics = second moment (ie assume PDFs are Gaussian and unbiased, <ε> = 0). PDF(ε) E.g. second moment of ε, <ε2> (called a variance), or <ε2>1/2 = σ (standard deviation). If only the variance is known, then the PDF is approximated as a Gaussian. P(ε) ~ exp – ε2/2<ε2> ε σ=√<ε2> ε
A B C D E F G H I This talk ... A. What quantities should be assigned error statistics in data assimilation? B. How are error statistics important in data assimilation? C. ‘Observation’ and ‘state’ vectors. D. ‘Inner’ and ‘outer’ products. E. Forms of (Gaussian) error covariances. F. Link between Bayes’ Theorem and the variational cost function. G. Link between the variational cost function and the ‘BLUE’ formula. H. Example with a single observation. I. Forecast error covariance statistics.
A B C D E F G H I A. What quantities should be assigned error statistics in data assimilation? • All data that are being fitted to. • Observations (real-world data). • Prior data for the system’s state. • Prior data for any unknown parameters. • Data that have been fitted. • Data assimilation-fitted data (analysis, ieposteriori error statistics). } Information available about the system before observations are considered.
A B C D E F G H I B. How are error statistics important in data assimilation? 1. Error statistics give a measure of confidence in data No assim Assim with large obs errors Assim with small obs errors
A B C D E F G H I B. How are error statistics important in data assimilation? 2. Error statistics of prior data imply relationships between variables time x2 Background forecast (no assim) Analysis forecast (consistent with prior and ob errors) x1 • x1 and x2 cannot be varied independently by the assimilation here because of the shape of the prior joint PDF. • Known relationships between variables are often exploited to gain knowledge of the complicated nature of the prior error statistics (e.g. changes in pressure are associated with changes in wind in the mid-latitude atmosphere (geostrophic balance).
A B C D E F G H I C. ‘Observation’ and ‘state’ vectors y = x = The structure of the state vector for the example of meteorological fields (u, v, θ, p, q are meteorological 3-D fields; λ, φ and ℓ are longitude, latitude and vertical level). There are n elements in total. The observation vector – comprising each observation made. There are p observations.
A B C D E F G H I D. ‘Inner’ and ‘outer’ products The inner product (‘scalar’ product) between two vectors gives a scalar The outer product between two vectors gives a matrix When ε is a vector of errors, <εεT> is a (symmetric) error covariance matrix
A B C D E F G H I E. Forms of (Gaussian) error covariances σ=√<ε2> The one-variable case The many variable case <x> 0
A B C D E F G H I F. Link between Bayes’ Theorem and the variational cost function • Bayes theorem links the following • PDF of the observations (given the truth) • PDF of the prior information (the background state) • PDF of the state (given the observations – this is the objective of data assimilation)
A B C D E F G H I G. Link between the variational cost function and the ‘BLUE’ formula
A B C D E F G H I H. Example with a single observation Analysis increment of the assimilation of a direct observation of one variable. Obs of atmospheric pressure →
A B C D E F G H I I. Forecast error covariance statistics • In data assimilation prior information often comes from a forecast. • Forecast error covariance statistics (Pf) specify how the forecast might be in error • εf = xf – xtrue, Pf = <εf εfT>. • How could Pf be estimated for use in data assimilation? • Analysis of innovations (*). • Differences of varying length forecasts. • Monte-Carlo method (*). • Forecast time lags. • Problems with the above methods. • A climatological average forecast error • covariance matrix is called B.
A B C D E F G H I I.1 Analysis of innovations We don’t know the truth, but we do have observations of the truth with known error statistics. Definition of observation error : y = ytrue + εy = h(xtrue) + εy Definition of forecast error : xtrue = xf – εf Eliminate xtrue : y = h(xf – εf) + εy ≈ h(xf ) - Hεf + εy ‘Innovation’ : y - h(xf ) ≈ εy - Hεf LHS (known), RHS(unknown) Take pairs of in-situ obs whose errors are uncorrelated (for variable v1, posn r and v2, r+Δr) y(v1,r) - xf(v1,r) ≈ εy(v1,r) - εf(v1,r) y(v2,r +Δr) - xf(v2,r +Δr) ≈ εy(v2,r +Δr) - εf(v2,r +Δr) Covariances <[y(v1,r) - xf(v1,r)] [y(v2,r +Δr) - xf(v2,r +Δr)]> = <[εy(v1,r) - εf(v1,r)] [εy(v2,r +Δr) - εf(v2,r +Δr)]> = <εy(v1,r) εy(v2,r +Δr)> - <εy(v1,r) εf(v2,r +Δr)> - <εf(v1,r ) εy(v2,r +Δr)> + <εf(v1,r) εf(v2,r +Δr)> ↑↑ ↑↑ Obs error covariance Zero (obs and forecast errors Forecast error covariance between (v1, r) and (v2, r+Δr) uncorrelated) between (v1, r) and (v2, r+Δr) zero unless v1=v2 and Δr=0 (one particular matrix element of Pf or B) <> average over available observations and sample population of forecasts
A B C D E F G H I I.2 Monte-Carlo method (ensembles) • N members of an ensemble of analyses. • Leads to N members of an ensemble of forecasts. • The ensemble must capture the errors contributing to forecast errors. • Initial condition errors (forecast/observation/assimilation errors from previous data assimilation). • Model formulation errors (finite resolution, unknown parameters, …). • Unknown forcing. • Can be used to estimate the forecast error covariance matrix, e.g. • Pf ≈ < (x-<x>) (x-<x>) T> = 1/(N-1) ∑i=1,N (xi - <x>) (xi - <x>)T • Problem: for some applications N << n. • n elements of the state vector (in Meteorology can be 107). • N ensemble members (typically 102). • Consequence – when Pf acts on a vector, the result is forced to lie in the sub-space spanned by the N ensemble members. Ensembles x t