Download
1 / 23
230 likes | 256 Views
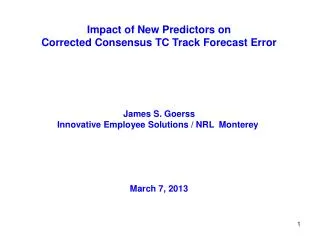
Prediction of Consensus TC Track Forecast Error and Correctors to Improve Consensus TC Track Forecasts Joint Hurricane Testbed Project James S. Goerss NRL Monterey March 22, 2006. Predicting TC Track Forecast Error.

E N D
Prediction of Consensus TC Track Forecast Error and Correctors to Improve Consensus TC Track Forecasts Joint Hurricane Testbed Project James S. Goerss NRL Monterey March 22, 2006
Predicting TC Track Forecast Error • Predictors of consensus forecast error must be quantities that are available prior to the time when official forecasts must be issued. • Consensus model spread is defined to be the average distance of the member forecasts from the consensus forecast. • The possible predictors are consensus model spread; initial and forecast TC intensity; initial TC location and forecast displacement of TC location (latitude and longitude); TC speed of motion; and number of members available (for CONU).
Predicting TC Track Forecast Error • Using stepwise linear regression and the aforementioned pool of predictors for the 2001-2004 seasons, regression models were found to predict consensus TC track forecast error for each combination of forecast length, consensus model, and basin. • The regression models were then used to determine the radii of circular areas drawn around the consensus model forecast positions within which the verifying TC position was expected to be contained approximately 75% of the time. • These circular areas were graphically displayed on the ATCF for use by the forecasters at NHC and JTWC.
2005 Atlantic Forecast Availability Percentage
72-h Predicted Consensus Error Hurricane Katrina - 12Z 26 August 2005
72-h Predicted Consensus Error Hurricane Katrina - 18Z 26 August 2005
72-h Predicted Consensus Error Hurricane Rita - 06Z 21 September 2005
48-h Predicted Consensus Error Hurricane Rita - 06Z 22 September 2005
2005 Atlantic and Eastern North Pacific Predicted Error Validation for CONU
Predicting Consensus Model Correctors • The techniques used to predict consensus error were applied to predict the east-west and north-south forecast error of the consensus models. • Regression models to predict CONU and GUNA east- west and north-south forecast error for all forecast lengths in the Atlantic were derived using the aforementioned pool of predictors for the 2001-2002, 2001-2003, and 2001-2004 seasons. • These predicted errors were then used as correctors to be applied to the consensus model forecasts for the 2003, 2004, and 2005 seasons, respectively.
Predicting Consensus Model Correctors • The mean of the CONU and GUNA east-west and north- south forecast errors for all forecast lengths in the Atlantic were also found for the 2001-2002, 2001-2003, and 2001-2004 seasons to be used as bias correctors for the consensus models for the 2003, 2004, and 2005 seasons, respectively. • For both CONU and GUNA, the bias correctors were found to be more effective than the statistical correctors derived using the regression models for forecast lengths less than or equal to 72 h. • For CONU, the application of only the statistical corrector for the north-south error was most effective at 96 h and 120 h. For GUNA, the application of the north- south statistical corrector and the east-west bias corrector was most effective at 96 h and 120 h.
Significance Level 97% 90% 99% 99% 99% 2003-2005 Atlantic TC Forecast Error (nm) Statistical Correction - Homogeneous Comparison 1075 873 716 572 456 Number of Forecasts
Significance Level 85% 80% 99% 99% 99% 921 731 577 431 314 Number of Forecasts 2003-2005 Atlantic TC Forecast Error (nm) Statistical Correction - Homogeneous Comparison
CONU and CCON Forecast Tracks Hurricane Wilma – 12Z 20 October 2005
Summary • For the 2005 Atlantic season, the circular areas displayed by the CONU Predicted Consensus Error product contained the verifying TC position 76%, 77%, 77%, 75%, and 75% of the time at 24 h, 48 h, 72 h, 96 h, and 120 h, respectively. • For the 2005 Atlantic season, the predicted radii for CONU varied from 30-200 nm at 24 h, 55-285 nm at 48 h, 60-370 nm at 72 h, 135-590 nm at 96 h, and 180-840 nm at 120 h. (NHC Potential Day 1-5 Track Area graphic uses 81, 150, 225, 282, and 374 nm, respectively) • For the 2005 eastern North Pacific season, the circular areas displayed by the CONU Predicted Consensus Error product contained the verifying TC position 76%, 84%, 83%, 90%, and 94% of the time at 24 h, 48 h, 72 h, 96 h, and 120 h, respectively. This was consistent with the exceptionally small CONU forecast errors of 80 nm at 48 h, 111 nm at 72 h, 136 nm at 96 h, and 161 nm at 120 h.
Summary • For the 2005 eastern North Pacific season, the predicted radii for CONU varied from 55-160 nm at 24 h, 110-205 nm at 48 h, 135-370 nm at 72 h, 175-450 nm at 96 h, and 255- 535 nm at 120 h. (NHC Potential Day 1-5 Track Area graphic uses 72, 131, 185, 196, and 223 nm, respectively). • Corrected consensus forecasts (CCON and CGUN) were derived for the 2003-2005 seasons using a combination of bias and regression-based statistical correctors. The CCON improvements were significant at the 99% level at 24-72 h, the 90% level at 96 h, and the 97% level at 120 h. The CGUN improvements were significant at the 99% level at 24-72 h, the 80% level at 96 h, and the 85% level at 120 h.
2005 Atlantic TC Forecast Error (nm) Statistical Correction from 2001-2004 Data Homogeneous Comparison 448 358 290 225 167 Number of Forecasts
2005 Atlantic TC Forecast Error (nm) Statistical Correction from 2001-2004 Data Homogeneous Comparison 386 297 216 154 90 Number of Forecasts
2004 Atlantic TC Forecast Error (nm) Statistical Correction from 2001-2003 Data Homogeneous Comparison 338 289 249 210 174 Number of Forecasts
2004 Atlantic TC Forecast Error (nm) Statistical Correction from 2001-2003 Data Homogeneous Comparison 299 253 216 165 132 Number of Forecasts
2003 Atlantic TC Forecast Error (nm) Statistical Correction from 2001-2002 Data Homogeneous Comparison 289 226 177 137 115 Number of Forecasts
2003 Atlantic TC Forecast Error (nm) Statistical Correction from 2001-2002 Data Homogeneous Comparison 236 181 145 112 92 Number of Forecasts