Download
1 / 1
10 likes | 154 Views
Improved OSB Formation Quality Through Production Process Control Using 3D Image Analysis and Laser Profilometry.

E N D
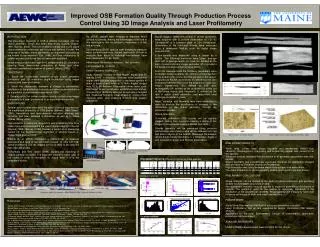
Improved OSB Formation Quality Through Production Process Control Using 3D Image Analysis and Laser Profilometry Digital images (1296x1016 pixels) of all the specimens were acquired with a uniform illumination of 1.2x10⁵ Candelas/m2 at a constant scale of 0.01 inches/pixel. Dimensions of the individual strands were measured using a developed MatLab code for digital image analysis (DIA). A sub-sample was measured using a caliper as a control. The following measures were taken: average width (W) & average length (L); area (A), defined as the sum of pixels in binary image; perimeter (P) or pixels in the borderline and convex hull area (CHA). From the measurements the following parameters were computed: shape regularity (S), defined as the proportion of the pixels in the convex hull that are also in the region, computed as A/CHA; eccentricity (E) defined as the ratio of distance between the foci of the ellipse and major axis length; slenderness (SL) defined as L/W ratio; rectangularity (R) defined as the proportion of pixels out of the binary region; and Irregularity (I) defined as the ratio of actual strand perimeter and equivalent ideal rectangle perimeter in pixels. Mean, Variance, and Normality tests were conducted in order to analyze the significance of changes in the distribution of the strand geometry through the production process. Strand Orientation Controlled orientation OSB boards will be digitally imaged during their formation creating a matrix of five images to be processed using a Matlab DIA code. Strands geometry will be measured using previous methodology and a laser profile will be obtained form top and bottom layers of the boards. Measured Parameters will be Single Strand Geometry; x, y Orientation Angle; z axis Orientation Angle; and Strands deformation. Hu (2005) applied laser imaging to measure wood surface roughness. Among the advantages of the use of this technique is that no contact is necessary, it is fast and accurate. Chuanshuang (2005) applied laser imaging to measure wood surface roughness. Recent application of laser to measure fiber angle in industrial environment have been developed (Chen, 2005). Advantages: No contact necessary, fast, accurate. EXPERIMENTAL DESIGN Strand Geometry Distribution Study material consists of Red Maple, Aspen and Fir strands 0.045” in thickness. Strander knife/counterknife angles were adjusted separately in the three species to attain a target strand width of ½ inch. Angles ranged from 70 to 85 degrees. Disposable knives were used. The target strand length was established at 6 inches. One pound of randomly selected strands were sampled and measured following initial stranding, drying (Koch conveyor drier) and screening (Trillium roller screen) operations. INTRODUCTION The anisotropic character of OSB is directly correlated with the strand alignment, which has been extensively studied (Shaler, 1991; Barnes, 2002). The role of strand overlap and out-of-plane strand orientation (waviness) are not as well defined. Further, the influence of variable strand geometries on alignment and packing are known to be important (Dai, 1994), but their relationship to optimal process conditions has not been well quantified. Image analysis have been applied to surface strand 2D orientation ignoring three dimensional orientation of flakes and other important geometrical properties of strands (Wang, 2000). OBJECTIVES 1. Study the relationship between single strand geometry distribution and 3D orientation angle distribution using image analysis and laser profilometry 2. Study the relationship between a change in geometrical distribution in the production line and orientation angle distribution as a predictor of mechanical properties of OSB. 3. Develop a tool for online formation quality control using image processing and laser profilometry in an industrial environment. BACKGROUND Several authors have addressed the effect of strand alignment on the mechanical properties of OSB boards (Barnes, 1988; Shaler, 1991). Geometrical and environmental variables affecting mat formation had been revealed in simulation as well as in actual studies (Wang, 2000). Improvements in resolution; acquisition and processing time have made more and more feasible the use of digital imaging in the mill (Barnes, 1988). Barnes (1998) claimed a patent on a measuring system for the bi-dimensional alignment of strands based on digital image analysis (DIA). Sladoje et. al. (2003) developed a methodology to measure perimeters and area in low resolution images. In mills with high speed processing, low-res images are more likely to be obtained than clear lab photos. El-Sombaty and M.A. Ismail (2003) studied the matching of objects partially occluded. The algorithm allows to match lines in the object in order to recognize its shape even if it is not completely visible. Group of strands binary image and the isolated corresponding measured strand Measurements on 5-layer pictures 5-layer image matrix used to study 3D orientation angle Diagram of image acquisition set up PRELIMINARY RESULTS Width, area, convex area, shape regularity and slenderness exhibit high variability. Rectangularity, irregularity and eccentricity appear less variant for all the species. Statistical analysis indicated that distribution of all geometric parameters was non-normal. Strand geometry has a statistically significant influence on distribution changes after processing of strands (drying and screening). High correlation was found between mean rectangularity and mean width. The initial distribution of strand geometry affects length/width ratio distribution. PRELIMINARY CONCLUSIONS Image Analysis can be applied to the study of strand orientation and geometry studies for automated acquisition of data. Non-parametric statistics must be applied to study the geometrical distribution of strands. The extraction point for the sample is statistically significant in the distribution of the geometrical variables. Rectangularity and Irregularity have high influence on change of width and length distributions. FUTURE WORK Study Strand Geometrical Distribution using non parametric statistics. Laser Profilometry. Set up and experimental design. Controlled OSB images analysis. Application to Industrial Environment. Design of experiments, application procedures and equipment. ACKNOWLEDGEMENTS USDA/CSREES Special Grant Award F 2003-34158-14006 Binary image of actual strand and the corresponding Convex Hull Image PRELIMINARY RESULTS: Influence of Species on strand geometry Distribution analysis Correlated variables Actual Profilometer STRANDER SCREENER CONVEYOR DRYER BLENDER FORMATION LINE Pilot plant used in this research. AEWC Center Facility. University of Maine at Orono References: •Barnes, Derek. A model of the effect of strand length and strand thickness on the strength properties of oriented wood composites. Forest Products Journal 51(2) 36-46 •Barnes Derek, John E. Ens., United States Patent 5764788, 6-9-1988. Research Plan. •Chen, Siguo. http://www.arc.ab.ca/Index.aspx/ARC/4367, 2005-2006 Alberta Research Council. •Dai, Chunping and Paul R. Stainer, Spatial structure of wood composites in relation to processing and performance characteristics Part 3. Modeling the formation of multi-layered random flake mats, Wood Science and Technology, Volume 28, Number 3, March 1994, pp: 229 - 239 •El-Sombaty Yasser, and M.A. Ismail. “Matching Occluded Objects Invariant to Rotations, Translations, Reflections, and Scale Changes. In Proceedings of the 13th Scandinavian Conference on Image Analysis, SCIA 2003, July 2003. pp 836-843. •Hu, C. and M. Afzal, “Automatic measurement of wood surface roughness by laser imaging.’ Forest Product Journal, Vol. 55 No. 12, 2005. pp 158-163. •Sladoje Natasia, Ingela Nystrom, and Punam K. Saha. “Measuring Perimeter and Area in Low Resolution Images Using Fuzzy Approach”. In Proceedings of the 13th Scandinavian Conference on Image Analysis, SCIA 2003, July 2003. pp 853-860. •Shaler, S.M. Comparing two measures of flake alignment. Wood Science and Technology. 1991. Vol. 26(1): 53-61. •Wang, Huaijun. “Creating Virtual Wood Particulate Composites”, Doctor of Philosophy Thesis (in Forest Resources). The University of Maine, December, 2000. •Wang, Siqum and Paul M. Winistorfer. Fundamentals of vertical density profile formation in wood composites. Part II Methodology of vertical density formation under dynamic conditions. Wood and Fiber Science. 32(2), 2000 pp. 220-238.