Download

1 / 7
80 likes | 181 Views
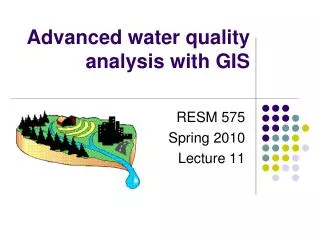
Analyze water quality images using rectangle tool to extract RGB values, input data into Excel for graphing. Calculate removal percentage for specific RGB values before and after treatment. Understand the effectiveness of treatment interventions.

E N D
Leaching Images: Use rectangle tool: RGB values => excel => graph
Treatment Images: Use rectangle tool: RGB values => excel => graph OR: Calculate % removal: for a specific rgb value % Removal = 100 * Concbefore - Concafter Concbefore Where… Concbefore = log _(Intensitycontrol)_ (Intensityleachate before) Concafter = log _(Intensitycontrol)_ (Intensityleachate after)
Red: 45 Green: 38 Blue: 11 Red: 53 Green: 54 Blue: 55 Alum Treatment Red: 53 Green: 52 Blue: 49
Treatment Images: Use rectangle tool: RGB values => excel => graph OR: Calculate % removal: for a specific rgb value % Removal = 100 * Concbefore - Concafter Concbefore Where… Concbefore = log _(55)_ = .699 (11) Concafter = log _(55)_ = .050 (49)
Treatment Images: Use rectangle tool: RGB values => excel => graph OR: Calculate % removal: for a specific rgb value % Removal = 100 * .699- .050 = 93% .699 Where… Concbefore = log _(55)_ = .699 (11) Concafter = log _(55)_ = .050 (49)