Download
1 / 29
290 likes | 316 Views
Explore retrieval techniques for cloud properties, including optical thickness and particle size, using satellite sensors like MODIS. Understand how clouds interact with different surfaces. Utilize atmospheric correction methods for accurate results.

E N D
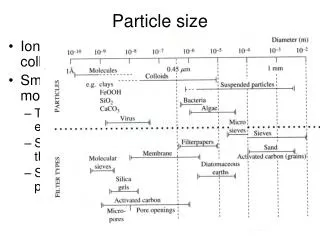
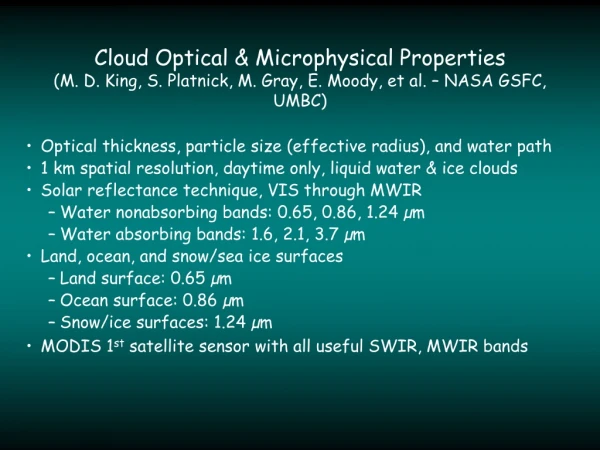
Cloud Optical & Microphysical Properties(M. D. King, S. Platnick, M. Gray, E. Moody, et al. – NASA GSFC, UMBC) • Optical thickness, particle size (effective radius), and water path • 1 km spatial resolution, daytime only, liquid water & ice clouds • Solar reflectance technique, VIS through MWIR • Water nonabsorbing bands: 0.65, 0.86, 1.24 µm • Water absorbing bands: 1.6, 2.1, 3.7 µm • Land, ocean, and snow/sea ice surfaces • Land surface: 0.65 µm • Ocean surface: 0.86 µm • Snow/ice surfaces: 1.24 µm • MODIS 1st satellite sensor with all useful SWIR, MWIR bands
Retrieval of tcand re Liquid Water Clouds - ocean surface • The reflection function of a nonabsorbing band (e.g., 0.86 µm) is primarily a function of optical thickness • The reflection function of a near-infrared absorbing band (e.g., 2.14 µm) is primarily a function of effective radius • clouds with small drops (or ice crystals) reflect more than those with large particles • For optically thick clouds, there is a near orthogonality in the retrieval of tc and re using a visible and near-infrared band
Retrieval of tcand re Ice Clouds - ocean surface • The reflection function of a nonabsorbing band (e.g., 0.86 µm) is primarily a function of optical thickness • The reflection function of a near-infrared absorbing band (e.g., 2.14 µm) is primarily a function of effective radius • clouds with small drops (or ice crystals) reflect more than those with large particles • For optically thick clouds, there is a near orthogonality in the retrieval of tc and re using a visible and near-infrared band
Cloud Optical & Microphysical Properties Retrieval Example Liquid Water Clouds - ocean surface Liquid Water Clouds - ice surface
Cloud Optical & Microphysical Properties • Critical input • Cloud mask • to retrieve or not to retrieve? • Cloud thermodynamic phase • use liquid water or ice libraries? • Surface albedo • for land, ancillary information regarding snow/ice extent (NISE data set) • Atmospheric correction • requires cloud top pressure, ancillary information regarding atmospheric moisture & temperature (e.g., NCEP, DAO, other MODIS products) • 3.7 µm emission (band contains both solar and emissive signal) • need cloud top temperature, ancillary for surface temperature (e.g., from NCEP, DAO, ...)
Ecosystem Map(A. H. Strahler, C. B. Schaaf, et al. – Boston University) MOD12 (IGBP ecosystem classification) + USGS water + tundra
Surface AlbedoSurface albedo = ecosystem + MOD43 (Strahler, Schaaf et al.) aggregation
Albedo Movies • Loops through bands 0.65, 0.86, • 1.24, 1.64, 2.1, and 3.7 µm • Loops through seasonal equinox • and solstice, progressing from • Julian days 91, 173, 293, 356 • Ecosystem Color Scheme • Pink = Crops • Green = Trees • Yellows = Barren/Deserts • Blues = Savannas
Atmospheric Correction • Cloud library calculations give cloud-top quantities (no atmosphere) • atmosphere included during retrieval • Rayleigh scattering • iterative approach applied to 0.65 µm band only (used over land) • important for thin clouds and for any clouds with large solar/view angle combinations • Atmospheric absorption • Well-mixed gases a function of pc, water vapor absorption a function of profile; both a weak function of temperature • Assume above-cloud column water vapor amount the primary parameter, vapor profile of minor consequence • Library calculations made at a variety of pc, above-cloud column water amounts (scaled from various water vapor and temperature profiles), geometries • using MODTRAN 4.0 with scripts for 2-way transmittance calculations • requires cloud top pressure, and ancillary information regarding atmospheric moisture (currently using NCEP)
Two-way Atmospheric Path Transmittance (1/µ + 1/µ0) 0.86, 1.24 µm pc = 900 hPa w = 2.0 g-cm-2 above-cloud precipitable water µ0 = 0.8 1.6 µm 0.67 µm 2.1 µm 3.7 µm (1-way µ path) Absorption transmittance 3.7 µm cosine of viewing zenith angle (µ)
Cloud Optical Thickness in the Arctic:Provisional Production Code (edition 3) June 2, 2001 tc 20 15 10 5 0
Cloud Optical Thickness in the Arctic:Provisional Production Code (new correction) June 2, 2001 tc 20 15 10 5 0
Cloud Effective Radius in the Arctic:Provisional Production Code (edition 3) June 2, 2001 re(µm) 40 34 28 22 16 10 4
Cloud Effective Radius in the Arctic:Provisional Production Code (new correction) June 2, 2001 re(µm) 40 34 28 22 16 10 4
True Color Image Cloud Mask Land Classification Cloud Optical Thickness Cloud Effective Radius Cloud Top Temperature Bispectral Phase Level-2 Global Cloud Images October 1, 2001
SAFARI 2000 Core Sites Mongu Okavango Delta Etosha Pan Maun Sua Pan Swakopmund Tshane Skukuza Namib Desert Inhaca Island Drakensberg escarpment
ER-2, C-130 ground tracks MODIS true color 11 Sept. 2000, 0940 UTC ER-2 Validation region C-130 (red = in-cloud portions)
MODIS droplet size retrievals optical thickness: C-130 ≈ 5, MODIS ≈ 3±1 UK C-130 in situ droplet radius, liquid water content 11 Sept. 2000, 0941-0953 UTC (S. Osborne, Met Office)
MODIS 18 Sept. C-130 11 Sept. CV-580 7 Sept. 13 Sept. 2 Sept. Namibian Sc often have significantly smaller droplet sizes than other regimes? Or lack the larger droplet sizes of other regimes? A difference in CCN concentrations? If so, why? Previous + SAFARI 2000 Namibian Sc studies California central valley fog AVHRR California Sc MAS Arctic stratus (Jan. & April 1989, 2 AM scenes, ) Namibian Sc AVHRR (Sep. 1999, 3 PM scenes) (Oct. 1995, SATE-2 validation) ATSR-2 0 5 10 15 20 25 cloud droplet effective radius (µm)
Comparison of Visible Optical Thickness(G. G. Mace, S. Bensen, K. Sassen – University of Utah) Retrieved Optical Thickness MOD06 Optical Thickness
Gridded Level-3 Joint Atmosphere Products(M. D. King, S. Platnick, P. A. Hubanks, et al. – NASA GSFC, UMBC) • Daily, 8-day, and monthly products (474.8, 883.2, 883.2 MB) • 1° ´1° equal angle grid • Mean, standard deviation, marginal probability density function, joint probability density functions
Cloud Optical Thickness Level-3 Monthly April 2001 tc 20 16 12 8 4 0
Cloud Effective Particle Radius Level-3 Monthly April 2001 re(µm) 40 34 28 22 16 10 4
MODIS L3 aggregation from 6°x 6° grid off Namibian coastliquid water clouds L3 product bin sizes (liquid water clouds)
Cloud Top Pressure(W. P. Menzel, R. Frey, K. Strabala, L. Gumley, et al. – NOAA NESDIS, U. Wisconsin/CIMSS) Level-3 Monthly April 2001 pc (hPa) 1000 900 800 700 600 500 400 300
Precipitable Water over Land & Sunglint(B. C. Gao, et al. – Naval Research Laboratory) Level-3 Monthly April 2001 q (cm) 7.0 6.0 5.0 4.0 3.0 2.0 1.0 0.0
MODIS Aerosol Optical Thickness & Effective Radius ta (0.55 µm) re 0.5 2.4 0.4 1.8 0.3 1.2 0.2 0.6 0.1 0.0 0.0
Aerosol Optical Thickness (fine mode)(Y. J. Kaufman, D. Tanré, L. A. Remer, D. A. Chu. – NASA GSFC, CNES/USTL) Level-3 Monthly September 2000 ta (0.55 µm) 0.8 0.7 0.6 0.5 0.4 0.3 0.2 0.1 0.0
Aerosol Optical Thickness (coarse mode)(Y. J. Kaufman, D. Tanré, L. A. Remer, D. A. Chu. – NASA GSFC, CNES/USTL) Level-3 Monthly September 2000 ta (0.55 µm) 0.4 0.3 0.2 0.1 0.0