Download
1 / 21
210 likes | 361 Views
Population Growth and Regulation. Learning Objectives. Be able to: Define x, N(x), S(x), F(x) and l(x) Calculate S(x) and l(x) Construct a life table Contrast cohort vs. static life tables. Concept 9.1 Life Tables.

E N D
Learning Objectives • Be able to: • Define x, N(x), S(x), F(x) and l(x) • Calculate S(x) and l(x) • Construct a life table • Contrast cohort vs. static life tables
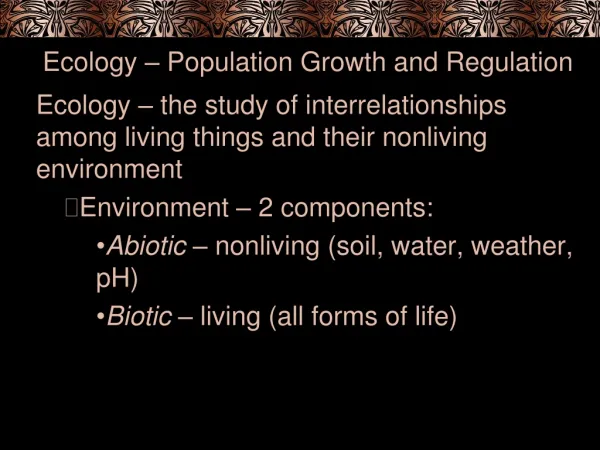
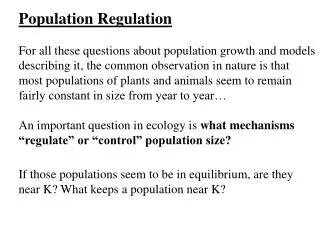
Concept 9.1Life Tables Information about births and deaths is essential to predict future population size. Concept 9.1: Life tables show how survival and reproductive rates vary with age, size, or life cycle stage.
Concept 9.1Life Tables A life table is a summary of how survival and reproductive rates vary with age. Life table data for the grass Poaannua were collected by marking 843 naturally germinating seedlings and then following their fates over time.
Concept 9.1Life Tables Sx = survival rate: Chance that an individual of age x will survive to age x + 1. lx = survivorship: Proportion of individuals that survive from birth to age x. Fx = fecundity: Average number of offspring a female will have at age x.
Concept 9.1Life Tables A cohort life table follows the fate of a group of individuals all born at the same time (a cohort). Mostly used for sessile organisms. Organisms that are highly mobile or have long life spans are difficult to track.
Concept 9.1Life Tables Static life table: Survival and reproduction of individuals of different ages during a single time period. It requires estimating the age of individuals.
Concept 9.1Life Tables Birth and death rates can vary greatly between individuals of different ages. In some species, age is not important, e.g., in many plants, reproduction is more dependent on size (related to growth conditions) than age. Life tables can also be based on size or life cycle stage.
Concept 9.1Life Tables Life tables for humans have many applications. Life insurance companies use census data to construct static life tables, to determine premiums to charge customers of different ages.
Concept 9.1Life Tables Comparing life tables for the United States and Gambia: Probability of survivorship for U.S. females remains high until age 70. In contrast, only 47%–62% of Gambians survived to reach age 45.
Concept 9.1Life Tables Gambians’ survivorship depends on the season of birth. Gambians born during the “hungry season” (when food stored from the previous year is depleted) had lower survivorship than those born at other times of the year.
Concept 9.1Life Tables Survivorship curve: Plot of the number of individuals from a hypothetical cohort that will survive to reach different ages. Survivorship curves can be classified into three general types.
Concept 9.1Life Tables Type I: Most individuals survive to old age (Dall sheep, humans). Type II: The chance of surviving remains constant throughout the lifetime (some birds). Type III: High death rates for young, those that reach adulthood survive well (species that produce a lot of offspring).
Figure 9.6 Species with Type I, II, and III Survivorship Curves (Part 1)
Figure 9.6 Species with Type I, II, and III Survivorship Curves (Part 2)
Figure 9.6 Species with Type I, II, and III Survivorship Curves (Part 3)
Concept 9.1Life Tables Survivorship curves can vary: Among populations of a species. Between males and females. Among cohorts that experience different environmental conditions.