Download
1 / 36
370 likes | 432 Views
Learn about the exponential and geometric models of population growth, demography, and the effects of human population growth on the environment. Explore the factors influencing population changes and the implications for the biosphere.

E N D
Chapter 14: Population Growth and Regulation Robert E. Ricklefs The Economy of Nature, Fifth Edition
Human Population Growth 1 • Growth of the human population is one of the most significant ecological developments in the earth’s history. • Early population growth was very slow: • 1 million individuals lived a million years ago • 3-5 million individuals lived at the start of the agricultural revolution (10,000 years ago)
Human Population Growth 2 • More recent population changes have been quite rapid: • population increased 100-fold from 10,000 years ago to start of eighteenth century • in the past 300 years, population has increased from 300 million to 6 billion, a 20-fold increase • the most recent doubling (3 billion to 6 billion) has taken place in the last 40 years
How many humans? • Has the human population exceeded the ability of the earth to support it? • there is no consensus on this point • clearly, continued growth will further stress the biosphere • When, and at what level, will the human population cease to grow? • there are many unknowns • the United Nations estimates a plateau at 9 billion
Demography • Demography is the study of populations: • involves the use of mathematical techniques to predict growth of populations • involves intensive study of both laboratory and natural populations, with emphasis on: • causes of population fluctuations • effects of crowding on birth and death rates
Populations grow by multiplication. • A population increases in proportion to its size, in a manner analogous to a savings account earning interest on principal: • at a 10% annual rate of increase: • a population of 100 adds 10 individuals in 1 year • a population of 1000 adds 100 individuals in 1 year • allowed to grow unchecked, a population growing at a constant rate would rapidly climb toward infinity
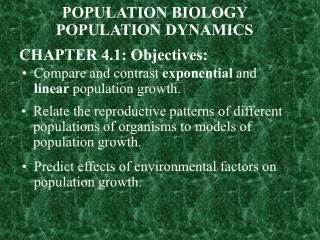
Two Models of Population Growth • Because of differences in life histories among different kinds of organisms, there is a need for two different models (mathematical expressions) for population growth: • exponential growth: appropriate when young individuals are added to the population continuously • geometric growth: appropriate when young individuals are added to the population at one particular time of the year or some other discrete interval
Exponential Population Growth 1 A population exhibiting exponential growth has a smooth curve of population increase as a function of time. The equation describing such growth is: N(t) = N(0)ert where:N(t) = number of individuals after t time units N(0) = initial population size r = exponential growth rate e = base of the natural logarithms (about 2.72)
Exponential Population Growth 2 • Exponential growth results in a continuously accelerating curve of increase (or continuously decelerating curve of decrease). • The rate at which individuals are added to the population is: dN/dt = rN • This equation encompasses two principles: • the exponential growth rate (r) expresses population increase on a “per individual basis” • the rate of increase (dN/dt) varies in direct proportion to N
Geometric Population Growth 1 Geometric growth results in seasonal patterns of population increase and decrease. The equation describing such growth is: N(t + 1) = N(t) where:N(t + 1) = number of individuals after 1 time unit N(t) = initial population size = ratio of population at any time to that 1 time unit earlier, such that λ = N(t + 1)/N(t)
Geometric Population Growth 2 To calculate the growth of a population over many time intervals, we multiply the original population size by the geometric growth rate for the appropriate number of intervals t: N(t) = N(0) t For a population growing at a geometric rate of 50% per year ( = 1.50), an initial population of N(0) = 100 would grow to N(10) = N(0) 10 = 5,767 in 10 years.
Exponential and geometric growth are related. Exponential and geometric growth equations describe the same data equally well. These models are related by: = er and loge = r
Varied Patterns of Population Change • A population is: • growing when > 1 or r > 0 • constant when = 1 or r = 0 • declining when < 1 (but > 0) or r < 0
Per Individual Population Growth Rates The per individual or per capita growth rates of a population are functions of component birth (b or B) and death (d or D) rates: r = b - d and = B - D While these per individual or per capita rates are not meaningful on an individual basis, they take on meaning at the population level.
Age structure determines population growth rate. When birth and death rates vary with the age of individuals in the population, contributions of younger and older individuals must be calculated separately. Age specific schedules of survival and fecundity enable us to project the population’s size and age structure into the future.
Stable Age Distribution • When a population grows with constant schedules of survival and fecundity, the population eventually reaches a stable age distribution (each age class represents a constant percentage of the total population): • Under a stable age distribution: • all age classes grow or decline at the same rate, • the population also grows or declines at this constant rate,
Life Tables • Life tables summarize demographic information (typically for females) in a convenient format, including: • age (x) • number alive • survivorship (lx): lx = s0s1s2s3 ... sx-1 • mortality rate (mx) • probability of survival between x and x+1 (sx) • fecundity (bx)
Cohort and Static Life Tables • Cohort life tables are based on data collected from a group of individuals born at the same time and followed throughout their lives: • difficult to apply to mobile and/or long-lived animals • used by Grants to construct life tables for Darwin’s finches on Galápagos Islands • Static life tables consider survival of individuals of known age during a single time interval: • require some means of determining ages of individuals • used by Olaus Murie to construct life tables for Dall mountain sheep in Denali National Park
The Intrinsic Rate of Increase 1 The Malthusian parameter (rm) or intrinsic rate of increase is the exponential rate of increase (r) assumed by a population with a stable age distribution. rm is approximated (ra) by performing several computations on a life table, starting with computation of R0, the net reproductive rate, (Σlxbx) across all age classes.
The Intrinsic Rate of Increase 2 • The net reproductive rate, R0, is the expected total number of offspring of an individual over the course of her life span. • R0 = 1 represents the replacement rate • R0 < 1 represents a declining population • R0 > 1 represents an increasing population • The generation time for the population is calculated as T = Σxlxbx/Σlxbx
The Intrinsic Rate of Increase 3 • Computation of ra is based on R0 and T as follows: ra = logeR0/T • Clearly, the intrinsic rate of natural increase depends on both the net reproductive rate and the generation time: • large values of R0 and small values of T lead to the most rapid population growth
Most populations have a great biological growth potential. • Consider the population growth of the ring-necked pheasant: • 8 individuals introduced to Protection Island, Washington, in 1937, increased to 1,325 adults in 5 years: • 166-fold increase • r = 1.02, = 2.78 • another way to quantify population growth is through doubling time: • t2 = loge2/loge = 0.69/loge = 0.675 yr or 246 days for the ring-necked pheasant
Environmental conditions and intrinsic rates of increase. • The intrinsic rate of increase depends on how individuals perform in that population’s environment. • Individuals from the same population subjected to different conditions can establish the reaction norm for intrinsic rate of increase across a range of conditions: • these vary within and between species
Intrinsic rate of increase is balanced by extrinsic factors. • Despite potential for exponential increase, most populations remain at relatively stable levels - why? • this paradox was noted by both Malthus and Darwin • for population growth to be checked requires a decrease in the birth rate, an increase in the death rate, or both
Consequences of Crowding for Population Growth • Crowding: • results in less food for individuals and their offspring • aggravates social strife • promotes the spread of disease • attracts the attention of predators • These factors act to slow and eventually halt population growth.
The Logistic Equation In 1910, Raymond Pearl and L.J. Reed analyzed data on the population of the United States since 1790, and attempted to project the population’s future growth. Census data showing a decline in the exponential rate of population growth suggested that r should decrease as a function of increasing N.
Behavior of the Logistic Equation • The logistic equation describes a population that stabilizes at its carrying capacity, K: • populations below K grow • populations above K decrease • a population at K remains constant • A small population growing according to the logistic equation exhibits sigmoid growth. • An inflection point at K/2 separates the accelerating and decelerating phases of population growth.
The Proposal of Pearl and Reed Pearl and Reed proposed that the relationship of r to N should take the form: r = r0(1 - N/K) in which K is the carrying capacity of the environment for the population. The modified differential equation for population growth is then the logistic equation: dN/dt = r0N(1 - N/K)
Pearl and Reed’s Projections Pearl and Reed projected a U.S. population stabilized at 197,273,000. The U.S. population reached this level between 1960 and 1970 and has continued to grow vigorously. Pearl and Reed could not have foreseen improvements in public health and medical treatment that raised survival rates.
Population size is regulated by density-dependent factors. • Only density-dependent factors, whose effects vary with crowding, can bring a population under control; such factors include: • food supply and places to live • effects of predators, parasites, and diseases • Density-independent factors may influence population size but cannot limit it; such factors include: • temperature, precipitation, catastrophic events
Density Dependence in Animals • Evidence for density-dependent regulation of populations comes from laboratory experiments on animals such as fruit flies: • fecundity and life span decline with increasing density in laboratory populations • Populations in nature show variation caused by density-independent factors, but also show the potential for regulation by density-dependent factors: • song sparrows exhibit density dependence of territory acquisition, fledging of young, and juvenile survival on density
Density Dependence in Plants 1 • Plants experience increased mortality and reduced fecundity at high densities, like animals. • Plants can also respond to crowding with slowed growth: • as planting density of flax seeds is increased, the average size achieved by individual plants declines and the distribution of sizes is altered
Density Dependence in Plants 2 • When plants are grown at very high densities, mortality results in declining density: • growth rates of survivors exceed the rate of decline of the population, so total weight of the planting increases: • in horseweed, a thousand-fold increase in average plant weight offsets a hundred-fold decrease in density
Self-Thinning Curve • A graph of log (average weight) versus log (density) for plants undergoing density-induced mortality has points falling on a line with slope of approximately -3/2: • this kind of graphical representation is known as a self-thinning curve • similar patterns are seen for a wide variety of plants: • this relationship is known as the -3/2 power law
Summary 1 Population growth can be described by both exponential and geometric growth equations. When birth and death rates vary by age, predicting future population growth requires knowledge of age-specific survival and fecundity. Life tables summarize demographic data. Analyses of life table data permit determination of population growth rates and stable age distributions.
Summary 2 Populations have potential for explosive growth, but all are eventually regulated by scarcity of resources and other density-dependent factors. Such factors restrict growth by decreasing birth and survival rates. Density-dependent population growth is described by the logistic equation. Both laboratory and field studies have shown how population regulation may be brought about by density-dependent processes.