Download
1 / 1
10 likes | 138 Views
Modeling and Validation of a Large Scale, Multiphase C arbon C apture System William A. Lane a , Kelsey R. Bilsback b , Emily M. Ryan a a Department of Mechanical Engineering, Boston University, Boston, MA 02215 b Department of Physics, Boston University, Boston, MA 02215. Overview.

E N D
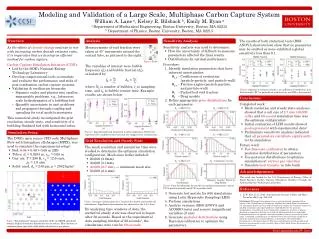
Modeling and Validation of a Large Scale, Multiphase Carbon Capture System William A. Lanea, Kelsey R. Bilsbackb, Emily M. Ryan a a Department of Mechanical Engineering, Boston University, Boston, MA 02215 b Department of Physics, Boston University, Boston, MA 02215 Overview Analysis Sensitivity Analysis The results of both statistical tests (BSS-ANOVA shown below) show that no parameter may be omitted as none exhibited a global sensitivity less than 0.1. • Sensitivity analysis was used to determine: • How the uncertainty of difficult-to-measure parameters affected the final results • Distributions for optimal performance • Procedure: • Identify simulation parameters that have inherent uncertainties: • θ1,2– Coefficients of restitution (particle-particle, and particle-wall) • θ3,4 – Friction angles (particle-particle, and particle-wall) • θ5 – Packed bed void fraction • θ6 – Drag models • Define appropriate prior distributions for each parameter: • Generate test matrix for (60) simulations using Latin Hypercube Sampling (LHS) • Perform simulations • Analyze variance (BSS-ANOVA and ACOSSO tests) and remove insignificant variables (if any) • Generate posterior distributions using Bayesian calibration to optimize the parameters • As the effects of climate change continue to rise with increasing carbon dioxide emission rates, it is imperative that we develop an efficient method for carbon capture. • Carbon Capture Simulation Initiative (CCSI): • Led by the DOE’s National Energy Technology Laboratory • Develop computational tools to simulate and evaluate the performance and risks of post-combustion carbon capture systems • Validation & verification hierarchy • Separate scales and physics into smaller, manageable problems, e.g., laboratory scale hydrodynamics of a bubbling bed • Quantify uncertainty in unit problems and propagate through coupling and upscaling for total model uncertainty • This numerical study investigated the grid resolution, steady state, and sensitivity of a bubbling fluidized bed with horizontal tubes. Measurements of void fraction were taken at 45˚ increments around the central tube, as pictured to the right. The variables of interest were bubble frequency (fb) and bubble fraction (δb), calculated by: where Nbis number of bubbles, tsis sampling time, and tbcis bubble contact time. Example results are shown below: Conclusions • Completed work: • Mesh resolution and steady state analyses showed that a cell size of 2.7 mm (40,000 cells), and 60 second simulation time was the optimum configuration • Initial evaluation of LHS results showed good agreement with experimental data1 • Preliminary sensitivity analysis indicated that all parameters contribute significantly to the simulation • Future work: • Use Bayesian calibrationto obtain posterior distributions of parameters • Use posterior distributions to optimize simulations at various gas velocities • Simulate heat transfer in tube bank Figure: Probe. Figure: Analysis of variance results, e is coefficient of restitution,ϕ is friction angle, EP* is packed bed void fraction, and DM is drag model. Figure: Experimental and numerical results comparison. Error bars represent 95% confidence intervals and are staggered for visualization. Simulation Setup • The DOE’s open source CFD code: Multiphase Flow with Interphase eXchanges (MFIX), was used to simulate the experimental setup1: • Bed: 0.34 × 0.48 × 0.60 m (2D) • Tubes: dt = 0.0254 m, stri = 0.08 m • Gas: air, T = 298 K, vg = 12.6 cm/s, • po= 1.0 atm • Solid: sand, dp= 240 μm, ρ = 2582 kg/m3 Grid Resolution and Steady State • The mesh resolution and simulation time were studied to determine the optimum simulation configuration. Mesh sizes (cells) included: • 20,000 (3.8mm) • 30,000 (3.1mm) • 40,000 (2.7 mm) → minimum mesh size • 50,000 (2.4 mm) Figure: Prior distributions for sensitivity analysis parameters, where P-P is particle-particle and P-W is particle-wall. Figure: Average void fractions at 0˚ location for 30,000 and 40,000 cell simulations. Significant discrepancies are observed in the 0.9–1 bins. Disclaimer: This report was prepared as an account of work sponsored by an agency of the United States Government. Neither the United States Government nor any agency thereof, nor any of their employees, makes any warranty, express or implied, or assumes any legal liability or responsibility for the accuracy, completeness, or usefulness of any information, apparatus, product, or process disclosed, or represents that its use would not infringe privately owned rights. Reference herein to any specific commercial product, process, or service by trade name, trademark, manufacturer, or otherwise does not necessarily constitute or imply its endorsement, recommendation, or favoring by the United States Government or any agency thereof. The views and opinions of authors expressed herein do not necessarily state or reflect those of the United States Government or any agency thereof. Acknowledgements By analyzing time windows of data, the statistical steady state was observed to began after 30 seconds. Based on the experimental data sampling window of 28 seconds1, the simulations were run for 60 seconds. This work was funded by the U.S. Department of Energy, Office of Fossil Energy's Carbon Capture Simulation Initiative through the National Energy Technology Laboratory. References Figure: Experimental1 domain schematic (left) and MFIX simulated domain (right). Schematic dimensions are in meters. Blue denotes an emulsion phase (gas and solid) while red denotes a gas phase. S. W. Kim et al., 2003, International Journal of Heat and Mass Transfer, 46(3), pp. 399–409. Email: lanew@bu.edu (W. Lane)