Download
1 / 27
270 likes | 433 Views
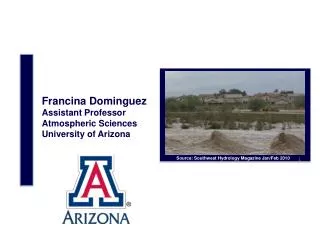
Source: Southwest Hydrology Magazine Mar/Apr 2005. Francina Dominguez Assistant Professor Atmospheric Sciences University of Arizona. Source: Southwest Hydrology Magazine Jan/Feb 2010. My Group and Research Interests. Postdoc Om Tripathi Extreme Events Precipitation recycling. PhD

E N D
Source: Southwest Hydrology Magazine Mar/Apr 2005 Francina Dominguez Assistant Professor Atmospheric Sciences University of Arizona Source: Southwest Hydrology Magazine Jan/Feb 2010
My Group and Research Interests • Postdoc • Om Tripathi • Extreme Events • Precipitation recycling PhD Erick Rivera - Extreme Events - Atmospheric Rivers Alejandro Martinez - Precipitation recycling in the Amazon Basin M.S. Ryan Fliehman - Extreme Events Jacob Meuth - Water vapor isotopes
We use eight different regional climate model simulations (NARCCAP* + UofA) over the Western US. Global Climate Models Regional Climate Models *North American Regional Climate Change Assessment Program Dominguez et al., 2012. Geophys. Res. Lett.
2038-2070 minus 1968-2000 Mean winter precipitation is projected to increase in the north and decrease in the south and west. Mean Winter Precipitation Ensemble change of models that pass significance t-test. Dominguez et al., 2012. Geophys. Res. Lett.
2038-2070 minus 1968-2000 Mean winter precipitation is projected to increase in the north and decrease in the south and west. Mean Winter Precipitation Extreme precipitation is projected to increase throughout the domain. 50-yr Return Period Winter Precipitation Bootstrappng significance test. Dominguez et al., 2012. Geophys. Res. Lett.
We are currently studying the physical mechanisms that could lead to the intensification of extreme events. UofA model Extreme Precip Change Atmospheric Rivers cm ? Integrated water vapor (IWV) The Special Sensor Microwave/Imager (SSM/I) AR Mogollon Rim
Forthe Verde RiverBasin, weused NARR precipitation data toobtain a list of eventsthatexceeded a highthreshold Daily winter (DJFM) precipitation at the Verde River Basin (1979-2010) Mogollon Rim VRB 98th percentile We identified the most important spatial patterns of integrated water vapor transport (IVT) associated to these extreme events.
The most dominant pattern shows the characteristic water vapor transport/corridor associated with ARs 1st Pattern of Integrated Water Vapor Explained variance: 29.4% SSM/I water vapor cm kg m-1 s-1 The Special Sensor Microwave/Imager (SSM/I) is located on the DoD satellites EOF 1
The second pattern of the integrated water vapor transport shows meridionally oriented ARs 2nd Pattern of Integrated Water Vapor Explained variance: 13.9% SSM/I water vapor cm kg m-1 s-1 EOF 2
RCM simulations show a consistent and statistically significant increase in extreme events in the Western US. We are currently investigating the physical mechanisms and the effects of spatial scale on these projections. Effect of Climate Variability and Change on Surface Hydrology • Extreme precipitation events. • Modeling of extremes - scale • Future work 40
Dynamical Downscaling: Uses a numerical model to generate finer-resolution information from coarser resolution information. GCM data Assumption: A finer resolution and/or improved model physics gives a “better” representation of weather and climate than the driving GCM. Regional Climate Model (WRF) “Better” may = more fidelity with observations and/or improved representation of physical processes Physically based - Regional Scale Future Projections (IPCC) Historical (Reanalysis) Dominguez et al., 2012. Geophys. Res. Lett.
RCM is a physically based model with enhanced representation of the terrain forcing and land-atmosphere interactions. Regional Climate Model (WRF) Clouds Precipitation Land Surface GCM data Radiation Dynamic core Boundary layer Regional Climate Model (WRF) Future Projections (IPCC) Historical (Reanalysis) Dominguez et al., 2012. Geophys. Res. Lett.
We use a ‘‘Poisson–GP model’’ to characterize the statistical distribution of extreme events. (Katz et al. 1999, 2002, 2010). We don’t use GEV theory because it is limited to block maxima. • Historical • Future • Historical • Future Poisson process models the occurrence. Generalized Pareto (GP) models the excess over the threshold. Example Salt River Basin, AZ Dominguez et al., 2012. Geophys. Res. Lett.
However, 24-hour 100-year events behave very differently than 3-hour 100-year events. Bias for 24-hour 100-year return period events. Ensemble mean bias +-10% Bias has a clear geographical pattern, For Annual Maximum, 26% are acceptable for design. Mishra, V., Dominguez, F. and Lettenmaier, D., 2012. Geophys. Res. Lett.
However, 24-hour 100-year events behave very differently than 3-hour 100-year events. Bias for 24-hour 100-year return period events. Bias for 3-hour 100-year return period events. Bias has a clear geographical pattern, 26% are acceptable for design. Generalized underestimation and 12% acceptable for design purposes. Mishra, V., Dominguez, F. and Lettenmaier, D., 2012. Geophys. Res. Lett.
Future: We are evaluating the effect of model resolution on the representation of extreme events. 50 km resolution 3-hrly 10 km resolution 1-hrly Use NCEP/DOE Reanalysis II data as boundary conditions (with spectral nudging). Period 1979-2010. Tripathi, O. and F. Dominguez In Preparation
Future: We are evaluating the effect of model resolution on the representation of extreme events. % Hits 24-hourly accumulated precipitation 50km. We find that the 10km runs more adequately capture the intensity of extreme events. We find that the 10km runs also have a higher “hit/miss” ratio than the 50km runs. % Hits 24-hourly accumulated precipitation 10km. Tripathi, O. and F. Dominguez In Preparation
ARs are long and narrowcorridors of concentratedwater vapor transport in thelowertroposphere Water vapor transport (IVT) AR Integrated water vapor (IWV) Conceptual representation of an AR Neiman et al. (2008) Ralph et al. (2011) 30-50% of annual precipitation in the west coast states occurs in just a few AR events (http://www.esrl.noaa.gov/psd/atmrivers/)
The extreme precipitation/flooding event of Feb. 20th, 1993 in the VRB was related to the occurrence of an AR SSM/I water vapor cm Providedby Phil Pearthree and Ann Youberg AZ Geological Survey Second largest peak discharge since 1891 (House et al., 1995)
The extreme precipitation/flooding event of Feb. 20th, 1993 in the VRB was related to the occurrence of an AR SSM/I water vapor cm Log jamupstream of Sheep Bridge, Verde River Providedby Phil Pearthree and Ann Youberg AZ Geological Survey Eight deaths and 112 injuries attributed to the floods of Jan-Feb ‘93. Damages exceeded $400 million (U.S. Army Corps of Engineers, 1994).
Future: We are also studying the impact of Atmospheric Rivers on extreme events in inland watersheds. Can we characterize ARs for the Southwestern US as compared to the more common West Coast ARs? Can regional climate models (RCMs) adequately capture historical ARs episodes in this region? What is the contribution of the ARs to the projected future changes of extreme winter precipitation intensity? Rivera, E. and F. Dominguez In Preparation
Future: Preliminary work shows that ARs account for a large percent of the variability of extreme events in the Verde River Basin (AZ). Multivariate EOF allows us to analyze the dominant modes of the vapor flux field ARs seem to have more of a meridional component in the Southwest. Rivera, E. and F. Dominguez In Preparation
The models realistically represent the spatial distribution of mean and extreme precipitation (1979-2000 period) All models have a positive bias in the mean. Mean Winter Precipitation mm/day 0 1 2 3 4 5 Eight Model Ensemble Observations Assimilated Observations Dominguez et al., 2012. Geophys. Res. Lett.
The models realistically represent the spatial distribution of mean and extreme precipitation (1979-2000 period) All models have a positive bias in the mean. Mean Winter Precipitation mm/day 0 1 2 3 4 5 50-yr Return Period Winter Precipitation All models have a positive bias in the extremes. mm/day 0 20 40 60 80 Dominguez et al., 2012. Geophys. Res. Lett.


![[f´‚nE˘RIks]](https://cdn0.slideserve.com/1072532/f-ne-riks-dt.jpg)