Download
1 / 31
310 likes | 483 Views
Wisconsin Dairy Ratio Benchmarking. Victor E. Cabrera & Jenny Vanderlin. Benchmarking. Monitor relationships of: Income generation Investment control Debt control Operating cost control Underlies important financial strengths and weaknesses Advisable not to use a single benchmark

E N D
Wisconsin Dairy Ratio Benchmarking Victor E. Cabrera & Jenny Vanderlin
Benchmarking • Monitor relationships of: • Income generation • Investment control • Debt control • Operating cost control • Underlies important financial strengths and weaknesses • Advisable not to use a single benchmark • Important comparisons could be done using ROROA, ROROE, ATO, OPM, DuPont Analysis
Financial Indicators • Sweet-15 financial measures: some people may use more, some people may use less • Five clusters of financial indicators are always needed • Liquidity • Solvency • Profitability • Repayment Capacity • Financial Efficiency
Financial Indicators • Liquidity • What is the ability of farm to generate enough cash to meet financial obligations (debt, taxes) and to cover family living expenses? • Solvency • How much of the farm is funded by debt? • Profitability • What is the ability of the farm to generate net income on a consistent basis?
Financial Indicators • Repayment Capacity • How well the farm can pay its bills? • Financial Efficiency • How well the farm uses its management and capital resources to generate profit?
Liquidity • Current Ratio (CR) • Net Working Capital (NWC)
1.a. Current Ratio (CR) • How well a farm manager can pay the bills this year? • Current Assets / Current Liabilities • >1.1,>1.7, Higher Better • Improve it by: • Increase cash reserves in good years • Improve profitability • Restructure debt • Sell under utilized assets to pay debt
1.b. Net Working Capital (NWC) • How much capital remains after paying bills this year? • Current Assets – Current Liabilities • >0, Higher Better • Improve it by: • Increase cash reserves in good years • Improve profitability • Restructure debt
2. Solvency • Debt to Asset Ratio (D/A) • Equity to Asset Ratio (E/A)
2.a. Debt to Asset Ratio (D/A) • What part of the farm is owned by the bank? • Total Farm Liabilities / Total Farm Assets • <60%, <30%, Lower Better, New farms or recently expanded farms have higher D/A • Improve it by: • Do nothing if farm is profitable: debt will decrease over time • Improve profitability • Take on (additional) partners
2.b. Equity to Asset Ratio (E/A) • How much of the farm the farmer owns? • Total Farm Equity / Total Farm Assets • >40%, >70%, Higher Better, New farms or recently expanded farms have lower E/A • Improve it by: • Do nothing if farm is profitable: debt will decrease over time • Improve profitability • Take on (additional) partners
3. Profitability • Net Farm Income (NFI) • Rate of Return on Farm Assets (ROROA) • Rate of Return on Farm Equity (ROREA) • Operating Profit Margin Ratio (OPM)
3.a. Net Farm Income (NFI) • How much farm profit is available to farmer? • Farm Revenues – Farm Expenses • >0, Higher Better, Competitive with other investment opportunities • Improve it by: • Improve profitability through: • Better marketing • Decreasing costs of production • Expand • Decrease number of partners • Sell under-utilized assets
3.b. Rate of Return on Farm Assets (ROROA) • What is the return on the farm assets? • (Net Farm Income + Interest Paid– Value Unpaid Labor & Management) / Average Farm Assets • >4%, >8%, Higher Better, Competitive with other investment opportunities, Larger than bank interest • Improve it by: • Improve profitability through: • Better marketing • Decreasing costs of production • Determine unrealized income such as increased land value • Renting productive assets, if profitable
3.c. Rate of Return on Farm Equity (ROROE) • What is the return on farm investment? • (Net Farm Income – Value Unpaid Labor & Management) / Average Farm Assets • >3%, >10%, Higher Better, Competitive with other investment opportunities, Larger than bank interest • Improve it by: • Improve profitability through: • Better marketing • Decreasing costs of production • Determine unrealized income such as increased land value • Rent productive assets, if profitable
3.d. Operating Profit Margin Ratio (OPM) • What proportion of farm revenue is profit? • (Net Farm Income + Interest Paid – Value Unpaid Labor & Management) / Gross Farm Revenues • >15%, >25%, Higher Better, Competitive with other investment opportunities, Generates sufficient level of income • Improve it by: • Improve profitability through: • Better marketing • Decreasing costs of production
4. Repayment Capacity • Term Debt Coverage Ratio (TDCR) • Replacement Margin (RM)
4.a. Term Debt Coverage Ratio (TDCR) • How well farm generates cash to pay term debts? • (Net Farm Income + Non-Farm Income + Scheduled Interest on Debt – Income Tax – Family Living Expenses) / (Scheduled Interest and Principal Debt, and Capital Lease Payments) • >120%,>150%, Higher Better • Improve it by: • Improve profitability • Improve non-farm income • Restructure debt • Improve tax management • Decrease family living expenses
4.b. Replacement Margin (RM) • How much income remains for the farm after paying all bills? • Net Farm Income + Non-Farm Income – Income Tax – Family Living Expenses -Scheduled Interest and Principal Debt, and Capital Lease Payments • >0, Higher Better • Improve it by: • Improve profitability • Improve non-farm income • Restructure debt • Improve tax management • Decrease family living expenses
5. Financial Efficiency • Asset Turnover Ratio (ATO) • Operating Expense Ratio (OER) • Depreciation Expense Ratio (DER) • Interest Expense Ratio (IER) • Net Farm Income Ratio
5.a. Asset Turnover Ratio (ATO) • What is the farm efficiency on capital use? • Gross Farm Revenues / Average Total Assets • >30%, >45%, Higher Better, Competitive with other investments • Improve it by: • Improve marketing • Rent additional assets if profitable • Assess asset valuation
5.b. Operating Expense Ratio (OER) • What is the proportion of gross farm revenues committed to pay operating expenses? • (Total Farm Operating Expenses + Purchased Feed & Feeder Livestock – Depreciation) / Gross Farm Revenues • <80%,<60%, Lower Better, Competitive with other investments • Improve it by: • Improve marketing • Improve production cost per unit • Decrease feed costs • Increase gross farm income
5.c. Depreciation Expense Ratio (DER) • What is the proportion of gross farm revenues committed to compensate depreciation expenses? • Depreciation Expenses / Gross Farm Revenues • <15%,<5%, Lower Better, Competitive with other investments • Improve it by: • Asses depreciation shield • Compare benefits of used vs. new equipment • Decrease the number of equipment • Compare benefits of custom hire vs. ownership • Assess technologies that require less equipment
5.d. Interest Expense Ratio • What is the proportion of gross farm revenues committed to pay interest expenses? • Interest Expenses / Gross Farm Revenues • <10%,<5%, Lower Better, Competitive with other investments • Improve it by: • Improve profitability and make additional principal payments • Increase cash revenues in good years to reduce the need of operating loans on bad years • Restructure debt
5.e. Net Farm Income Ratio (NFIR) • What is the proportion of gross farm revenues available to compensate for unpaid labor and management? • Net Farm Income / Gross Farm Revenues • >10%,>20%, Lower Better, Competitive with other investments, Generating a sufficient income level • Improve it by: • Improve profitability through: • Better marketing • Decreasing production costs
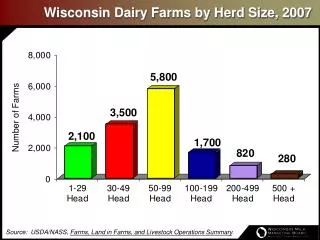
Wisconsin Dairy Farm Ratio Benchmarking Tool • Sweet-15 financial analysis measures • Benchmarking with +500 Wisconsin farms • Cluster analysis • Year • Herd size: 50, 100, 150, 300, >300 • Income/cow: $4,000, $4,500, $5,000, >$5,500 • Milk/cow: 16,000, 19,000, 22,000, >25,000 • DuPont analysis • ROROA = ATO * OPM
Wisconsin Dairy Farm Ratio Benchmarking Tool Specific Farm Ratio Distribution for Wisconsin Industry Industry Better Recommended Level Industry Minimum Recommended Level