Tetraspanin mRNA Expression in Human and Mouse Platelets
Explore tetraspanin mRNA expression in human and mouse platelets using paired-end RNA sequencing data. The Y-axis shows reads per kilobase of exon model per million mapped reads (RPKM).

Tetraspanin mRNA Expression in Human and Mouse Platelets
E N D
Presentation Transcript
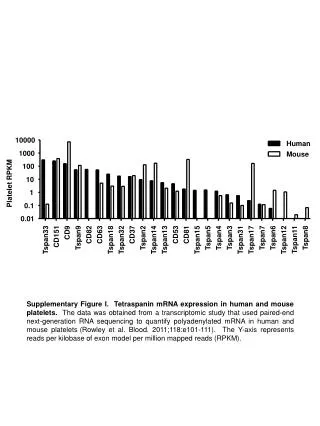
Human Mouse 10000 1000 100 10 Platelet RPKM 1 0.1 0.01 CD9 CD82 CD63 CD37 CD53 CD81 CD151 Tspan9 Tspan2 Tspan5 Tspan4 Tspan3 Tspan7 Tspan6 Tspan8 Tspan11 Tspan33 Tspan18 Tspan32 Tspan14 Tspan13 Tspan15 Tspan31 Tspan17 Tspan12 Supplementary Figure I. Tetraspanin mRNA expression in human and mouse platelets.The data was obtained from a transcriptomic study that used paired-end next-generation RNA sequencing to quantify polyadenylated mRNA in human and mouse platelets(Rowley et al. Blood. 2011;118:e101-111). The Y-axis represents reads per kilobase of exon model per million mapped reads (RPKM).