Download

1 / 19
280 likes | 998 Views
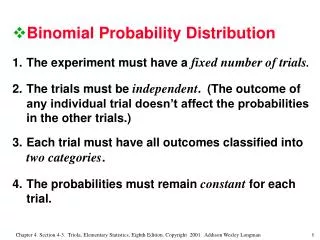
Binomial Probability Distribution 1. The experiment must have a fixed number of trials . 2. The trials must be independent . (The outcome of any individual trial doesn’t affect the probabilities in the other trials.) 3. Each trial must have all outcomes classified into two categories .

E N D
Binomial Probability Distribution 1. The experiment must have a fixed number of trials. 2. The trials must be independent. (The outcome of any individual trial doesn’t affect the probabilities in the other trials.) 3. Each trial must have all outcomes classified into two categories. 4. The probabilities must remain constantfor each trial.
Example:Construct a probability distribution table for the number of girls born if a couple has 4 children. This can also be done by using the TI – 83 / 84
1) use the formula P(x) = nCx• px•qn-x 2) UseTable A-1 in Appendix A 3) Use the TI – 83 / 84 There are three methods for calculating Binomial Probability Distributions
Method 1 Binomial Probability Formula
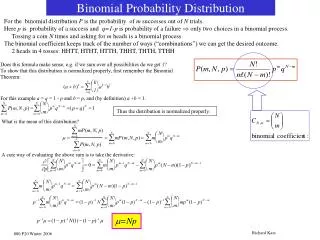
Method 1 Binomial Probability Formula n! • P(x) = • px• qn-x (n - x )! x!
Method 1 Binomial Probability Formula n! • P(x) = • px• qn-x (n - x )! x! • P(x) = nCx• px•qn-x for calculators with nCr key, where r = x
This is a binomial experiment where: n = 5 x = 3 p = 0.90 q = 0.10 Use method 1: Example: Find the probability of getting exactly 3 correct responses among 5 different requests from AT&T directory assistance. Assume in general, AT&T is correct 90% of the time.
This is a binomial experiment where: n = 5 x = 3 p = 0.90 q = 0.10 Using the binomial probability formula to solve: P(3) = 5C3• 0.9 • 01 = 0.0.0729 Example: Find the probability of getting exactly 3 correct responses among 5 different requests from AT&T directory assistance. Assume in general, AT&T is correct 90% of the time. 2 3
Method 2 Table A-1 in Appendix A P(x) n x 0 1 2 3 4 5 For n = 5 and p = 0.90 0.000 0.000 0.008 0.073 0.328 0.590 5 Table A-1
Example (a): Find the probability of getting exactly 3 correct responses among 5 different requests from AT&T directory assistance. Assume in general, AT&T is correct 90% of the time. Using Table A-1 Use method 2:
Example (b) : Find the probability of getting at least 3 correct responses among 5 different requests from AT&T directory assistance. Assume in general, AT&T is correct 90% of the time. Using Table A-1 Use method 2:
Solution: a) P(3) = 0.073 b) P(at least 3) = P(3 or 4 or 5) = P(3) or P(4) or P(5) = 0.073 + 0.328 + 0.590 = 0.991 Method 2
Example (a): Find the probability of getting exactly 3 correct responses among 5 different requests from AT&T directory assistance. Assume in general, AT&T is correct 90% of the time. Using your calculator Use method 3:
Example (a): Find the probability of getting at least 3 correct responses among 5 different requests from AT&T directory assistance. Assume in general, AT&T is correct 90% of the time. Using your calculator Use method 3:
Solution: A) binomialPDF(n,p,x) = 0.073 B) “ at least 3” means 3,4,5 so find the probability of 0, 1, 2 and subtract this from one. 1-BinomialCDF(n,p,x) = 0.991 Method 3
µ = [x • P(x)] 2= [ x 2• P(x) ] - µ 2 MEAN, VARIANCE, STANDARD DEVIATIONFor Any Discrete Probability Distribution: = [ x 2• P(x) ] - µ 2
µ = n • p 2 = n • p • q For Binomial Distributions ONLY: = n • p • q
We previously discovered that this scenario could be considered a binomial experiment where: n = 14 p = 0.5 q = 0.5 Using the binomial distribution formulas: Example: Find the mean and standard deviation for the number of girls in groups of 14 births.
We previously discovered that this scenario could be considered a binomial experiment where: n = 14 p = 0.5 q = 0.5 Using the binomial distribution formulas: µ = (14)(0.5) = 7 girls = (14)(0.5)(0.5) = 1.9 girls (rounded) Example:Find the mean and standard deviation for the number of girls in groups of 14 births.