Download

1 / 14
140 likes | 167 Views
Explore the impact of population growth on greenhouse gas emissions and temperature changes in the US using agent-based modeling. Investigate the negative feedback loop between population size and global warming effects, aiming to achieve equilibrium. Utilize NetLogo simulation with detailed maps and dynamic agent interactions. Analyze factors such as elevation, temperature, birth/death rates, and city populations. Project future scenarios to determine sustainable population levels and temperature thresholds.

E N D
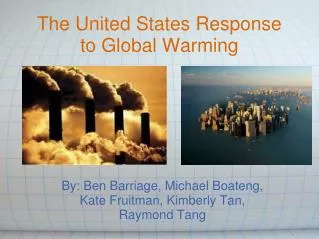
Simulation of Global Warming in the Continental United States Using Agent-Based Modeling By Marika Lohmus
Purpose • What is the relationship between population and global warming? • More people → more greenhouse gases • More greenhouse gases → higher temperatures • Higher temperatures → less people Population size Greenhouse gases Temperature Figure 1: Negative Feedback Loop
Purpose Cont. • With a negative feedback loop, there should be an oscillating representation of the temperature and population size which should level off. • When, at what temperature and at what cost?
1st Quarter Work • NetLogo • Got elevation data from previous project • Started Temperature map • Took me most of 1st quarter Fig 2: Q1 Temperature Map Fig 3: Elevation Map
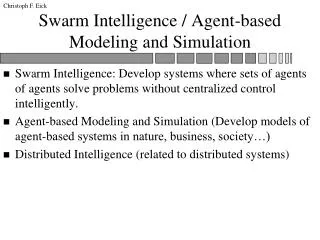
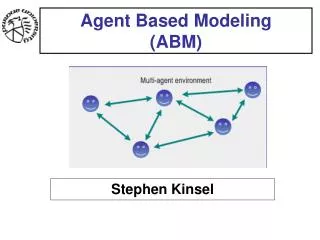
2nd Quarter • Concentration: • Temperature • System Dynamics • Agents • Patches • Turtles • People • Cities
People Salary 1/10,000 Cities Median Salary Poverty percent Name Agents • Patches • Elevation • Temperature • Death-rate • Birth-rate • Turtles • Act as borders • Negative values
Patches • Change color as elevation or temperature changes • Color determined by change in average global temperature Fig 5: Temperature Increase
Another random number generated to determine whether the agent will move or not Looks better – otherwise people stay in one place People • Turtle-like agents • Human shape • Random number generated for each – birth rate and death rate per 10,000 people per year
Total greenhouse gas emissions determined by population size # Factories increase as population increases Assumption • Total population of the united states = population of all the largest cities • Everyone lives in large cities • Everyone has an equal effect on greenhouse gas output
3rd Quarter Projections • People: • Will be able to move according to salary • What temperature is unreasonable? • Will birth-rates change? • Patches: • More reasonable elevation changes
Current Results Fig 7: Temperature Data Fig 8: Population Data Equilibrium between temperature and population?