Download
1 / 20
200 likes | 292 Views
This research combines simulations and data to predict rare events like pyroclastic flows from volcanoes. The study aims to develop a hazard map based on the frequency-volume distribution and stochastic nature of the system. By using Monte-Carlo simulations with TITAN software, the researchers seek to identify regions at risk and calculate the probability of catastrophic events. The methodology involves building emulators to analyze flow parameters and estimate the likelihood of pyroclastic events hitting specific targets. The approach offers a way to combine data, simulation, and emulation to calculate probabilities of rare events accurately. Future directions include validating the model in the Tar River Valley and expanding the analysis to include additional input parameters like initiation velocity and friction angles.

E N D
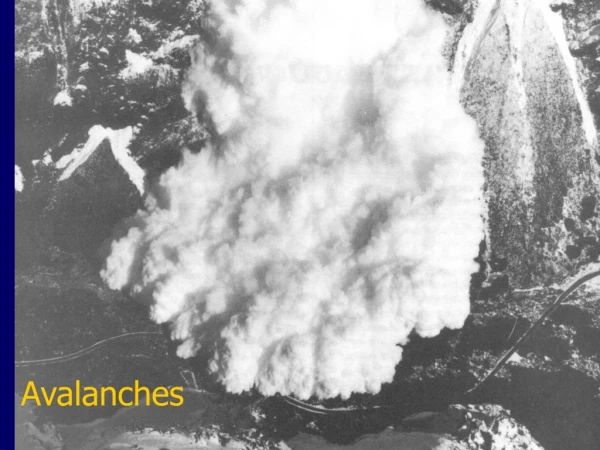
Models for Volcano Avalanches A Risk Map for Pyroclastic Flows: Combining simulations and data to predict rare events Bruce Pitman, Robert Wolpert, Elaine Spiller The University at Buffalo, Duke University, and SAMSI SAMSI Transition Workshop May 14-16, 2007
The Questions • What is the frequency-volume distribution? • How can one develop a hazard map? • How does one perform enough simulations or evaluation of emulators to develop the map? • What about regions where probability of flow is very small?
Predictive distribution Reflects: • Uncertainty about α, λ • Stochastic nature of system Problem: • Pareto has heavy tails => probability of at least one very large flow event over decades-long period
Hazard map Idea • Sample from predictive v-f distribution • Monte-Carlo (MC) to find flow probability contours (i.e. hazard map) • Simulations with TITAN software Problem • Cannot tell us about very small probability events --- (hopefully) significant flow in populated areas is a rare event
A first problem: • Consider one interesting location, i.e., center of town, proposed school location • Find probability that max flow height exceeds critical height over, say, 100 years. • Equivalent to finding most likely combination of initial volume and flow angles that generates flows where max height > critical height.
Plan of attack 1. Course grid • Begin with course grid over volume/initiation angle design space • Run flow simulations and collect max flow height at location of interest • Emulate max height surface Goal • Identify “interesting” region of design space to narrow search Bonus • Might suggest useful regression functions
Emulator • Inputs (…for now) -volume, v, and angle, θ • Output -height h(v, θ) (or some reasonable metric) • Interesting region -interested in contour where h(v, θ)=hcrit -ψ(θ)=v => h(ψ(θ) , θ)=hcrit
Plan • Build emulator on sub-design space • Identify ψ(θ) and reasonable volume bounds from confidence interval • Error on side of smaller volumes producing hits • Use ψ(θ) and predictive volume/flow distribution to calculate probability of catastrophic pyroclastic event hitting target
Ω={V,θ : h(V,θ) ≥ hcrit} • Truth: ψ* and Ω* • Within Ω* a hit, H, has occured
Probability of hit • Eruptions independent • Adjust probability above to account for event frequency, λ_ε and prediction time interval (~100 years)
Emulator guided sampling • Want to sample important θs • Integrate directly, plug in ψ(θ) • Draw θs by rejection sampling
Probability estimate • Upper bound on estimate • Draw θs as described • MC, can calculate […] exactly • For cartoon, about 10^-8
Plan to do better • Draw θs as before • For each θ, draw a v from f(v| θ) • If (θ,v) in thatched area, run simulator to see if hit occurred. If so, update probability estimate • Update confidence bands based on new simulator runs • iterate
Conclusions/remarks • Proposed a method to combine data, simulation, and emulation for calculating probabilities of rare events • Probability calculations are “free” once we have a decent grasp on ψ(θ) • Gives us some flexibility to redo calculations for a range of flow-volume parameters
Future directions • Implement plan – run simulator, build emulate, define ψ(θ), calculate probabilities • Include other input parameters – initiation velocity, friction angles • Validation
Tar River Valley May 3, 2007 March 29, 2007, from Old Towne