Download
1 / 46
460 likes | 544 Views
EAS 4/8803: Experimental Methods in AQ. Week 11: Air Quality Management (AQM) Clean Air Act (History, Objectives, NAAQS) Emissions and Atmospheric Trends (Links) Principal Measurement Techniques (NOx, CO, SO 2 ) Measurement of CO (Exp 5)

E N D
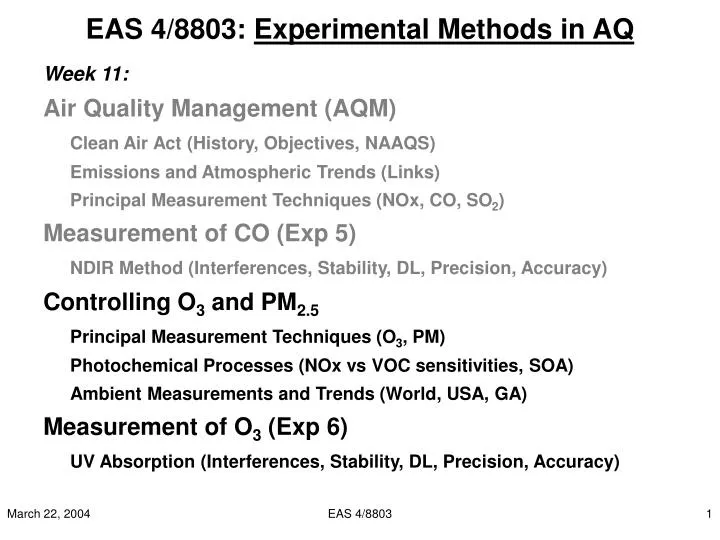
EAS 4/8803: Experimental Methods in AQ Week 11: Air Quality Management (AQM) Clean Air Act (History, Objectives, NAAQS) Emissions and Atmospheric Trends (Links) Principal Measurement Techniques (NOx, CO, SO2) Measurement of CO (Exp 5) NDIR Method (Interferences, Stability, DL, Precision, Accuracy) Controlling O3 and PM2.5 Principal Measurement Techniques (O3, PM) Photochemical Processes (NOx vs VOC sensitivities, SOA) Ambient Measurements and Trends (World, USA, GA) Measurement of O3 (Exp 6) UV Absorption (Interferences, Stability, DL, Precision, Accuracy) EAS 4/8803
MnO2 400C IR A-Cell ZT Vent out during calibration Tee NV set so that ΔP(Tee-NO) in Sample mode = ΔP(Tee-NC) in Zero mode Manual connect during calibration 10 sccm CO NC MFM 1425 ppmv in N2 C Zero Air MFC 10 slm NO Review CO Lab Experiment CO Analyzer Calibration EAS 4/8803
T Thermo-electrically cooled PbSe insulation 16 m 30 Hz 360 Hz modulation 4.7 mm Review CO Lab Experiment CO Method: IR-Absorption I = I0 e-e c l EAS 4/8803
Review CO Lab Experiment EAS 4/8803
COspan4 5 V COspan3 COspan2 D[COnom]4 CO Analyzer Signal (V) D[COnom]3 zero-mode zero-mode COspan1 D[COnom]2 D[COnom]1 COZA COZA Zero-air COspan1,0 COspan4,0 Zero-air/Zero-mode = baseline CO0 CO0 Time (minutes) Review CO Lab Experiment CO Analyzer Calibration and Zero-Trap Efficiency COsensi (ppb/V) = D[COnomi] / DCOspani ZTeffi = (COspani – COspani,0) / (COspani – CO0) If ZTeff < 0.9, correct CO0 CO0* (V) = CO0 / ZTeff – COipol * (1/ZTeff-1) COnet (V) = COraw – CO0*ipol CO (ppb) = COnet * COsens DL (ppb) = t * STD(CO0*) * COsens P (%) = t * STD(COsens) / AVG(COsens) *100 A1 (%) = (slope{D[COnomi] / DCOspani} -1000) *100 A2 (%) = {S[(s(Xj))2 (dCOsens/dXj)2]}1/2 …from error propagation analysis. EAS 4/8803
Emissions/AQ Trends:O3 Secondary Product !! old 1h NAAQS new 8h NAAQS • Potential Risks andEffects • Acute health (respiration, asthma) • Chronic health (obstructive pulmonary) • Vegetation damage (chlorophyll) • Agriculture (crop & forest yields) • Materials deterioration EAS 4/8803
NO + O3 NO2* + O2 NO + O3 NO2 + O2 NO2* NO2 + hv (front edge max 630nm) NO2* + M NO2 + M (collisional quenching) Chemiluminescence of NO2* Ambient sample from inlet Hz Excess NO or C2H4 PMT HV PMT C2H4 + O3 2 HCHO* + O2 C2H4 + O3 2 HCHO + O2 HCHO* HCHO + hv (broadband max 440nm) HCHO* + M HCHO + M (collisional quenching) Chemiluminescence of HCHO* C Chemi-lumi-nescence 600-3200 max 1200 nm Reaction Vessel NC NO Zero Volume Trap O3 Method: Chemiluminescence Disadvantage: Need of Process Gases EAS 4/8803
O3 Method: UV Absorption I = I0 e-e c l e = 308 cm-1(@STP: 0oC, 760Torr) l = 38 cm 254 nm EAS 4/8803
Two Teflon chambers linked by ion bridge Cathode: 0.06 mol/l (1% KI) Anode: 8.0 mol/l (saturated KI) Redox reaction of ambient O3 in cathode: 2 KI + O3 + H2O I2 + O2 + 2 KOH I2 + 2 e- + Pt 2 I- (cathode reaction) Release of 2 e- at anode Pt mesh electrode: 2 I- + Pt I2 + 2 e- (anode reaction) Overall: 2 e- per O3 titrated. O3 Method: ECC Electro-Chemical Cell used in balloon sondes Advantage: size (8x8x14 cm) and weight (< 300 g) EAS 4/8803
Emissions/AQ Trends: PM2.5 Primary Sources (2001) Emissions AQ • Potential Risks andEffects • Heart (arrhythmias, attacks) • Respiratory (asthma, bronchitis) • Among elderly and young • Vegetation (ecosystem) • Buildings, Materials • Visibility AQ influenced by Primary + Secondary PM EAS 4/8803
Sources and Mechanisms of Atmospheric PM Meng et al., Science, 1997 EAS 4/8803
Secondary organic aerosol (SOA): Organic compounds, some highly oxygenated, residing in the aerosol phase as a function of atmospheric reactions that occur in either gas or particle phases. SOA formation depends on: Precursors aromatics (BTX, aldehydes, carbonyls) terpenes (mono-, sesqui-) other biogenics (aldehydes, alcohols) Presence of O3, OH, NO3, sunlight, acid catalysts Mechanisms (with few hr yields): Gas-to-particle conversion/partitioning e.g. terpene oxidation Heterogeneous reactions aldehydes via hydration, polymerization, forming hemiacetal/acetal in presence of alcohols Particle-phase reactions acetal formation catalytically accelerated by Meng et al., Science, 1997 particle sulfuric acid (Jang and Kamens, ES&T, 2001) EAS 4/8803
Other (Inorganic) Secondary PM2.5 Formation Secondary formation is a function of many factors including: concentrations of precursors, other gaseous reactive species (e.g., O3, OH), atmospheric conditions, and cloud or fog droplet interactions. BUT: Most secondary products remain semi-volatile and can evaporate back into the gas-phase! Gas-to-particle conversion (oxidation) SO2(g) HOSO3 H2SO4 + 2NH3 (NH4)2SO4 NOx(g) HNO3 + NH3 NH4NO3 Heterogeneous reactions EAS 4/8803
Partitioning of Semi-Volatile Species Ambient PM2.5 is composed of primary and secondary components of particle-phase species. A large fraction of secondary PM in the atmosphere is in a fragile balance (equilibrium) between its gas-phase precursors and particle-phase products, meeting individual species’ vapor pressures and physical-chemical micro-environments at given ambient conditions. The gas-particle partitioning of these semi-volatile species can easily be altered during sample collection and analysis! PM2.5 Measurement Challenge EAS 4/8803
Well Impactor Ninety-Six Sharp Cut Cyclone Classical Cyclone Separating PM2.5 at Sample Inlet EAS 4/8803
Potential Gas/Particle Interactions at a Filter Surface DP EAS 4/8803
air Discrete PM2.5 Sampling Method, e.g. FRM Ambient sample air containing PM2.5 (aerosol) passes through a filter, which collects the “particle phase” then through an adsorber, which traps the “gas phase” compounds. This method suffers from potential positive and mostly negative artifacts !! Filter Adsorber EAS 4/8803
air Denuder gas phase Filter Particle phase Adsorber Denuder (Diffusion Tube) Application Air passes through an annular diffusion tube (gas phase) then through a filter (particle phase) then through an adsorber to trap the compounds released from the surface of the particles. The denuder is coated with a material that will trap the gas phase molecules. Each sampling medium is extracted separately for direct quantification of: NH3, HONO, HNO3, SO2, Formic, Acetic, Oxalic; Na+, NH4+, Cl-, NO2-, NO3-, SO4=, Formate, Acetate, Oxalate; EC, OC, and “SVOC” EAS 4/8803
air Denuder gas phase Filter Adsorber Total Gas & Particle Particle phase Denuder Difference Method Air passes through an annular diffusion tube (gas phase) then through a filter (particle phase) then through an adsorber to trap the compounds released from the surface of the particles. The denuder is coated with a material that will trap the gas phase molecules. Indirect determination of gas phase concentrations from PM-difference. EAS 4/8803
Utilizing Fast Gas Diffusion to Walls Denuder Fluid Dynamics and Efficiency (for annulus) where …and making gas molecules stick! EAS 4/8803
Diffusion Coefficients Gas vs PM D (cm2/s) NH3 0.24 HONO 0.17 HNO3 0.15 NO2 0.14 SO2 0.13 HCOOH 0.18 CH3COOH 0.15 (COOH)2 0.13 0.01 5.20E-4 0.05 2.33E-5 0.1 6.71E-6 0.5 6.24E-7 1.0 2.72E-7 1.6 1.61E-7 Reactive gases Particles with diameter (mm) EAS 4/8803
Providing Large Wall Surface for Gas Adsorption Possible Denuder Configurations Tubular Annular Gundel et al. IOVPS Kamens et al. IOVPS ETS Smog chamber studies Multi-channel annular Possanzini et al. Lane et al. GAP sampler Lane and Gundel IOGAPS Theoretical Ambient air Ambient air Capillary bundle Hites et al. Ambient air Human exposure Parallel plate Eatough et al. BOSS, Big BOSS, RAMS Ambient Air - interest in particles only Honeycomb Koutrakis et al. Harvard Ambient air Human exposure EAS 4/8803
Making Gases Stick: Scanning electron photomicrograph of an uncoated sandblasted glass denuder fragment EAS 4/8803
Making Gases Stick: Scanning electron photomicrograph of a denuder fragment coated with ground XAD-4 adsorbent EAS 4/8803
for situations where m = D(d)LW/(Qh)>0.003 D(d) = diffusion coefficient of the particle of diameter d L= the channel width in the direction of flow W for an annular denuder = p(d1+d2)/2 d1 is the inner diameter of the annulus d2 is the outer diameter of the annulus h for an annular denuder = p(d2-d1)/2 Q = Flow rate Particle Loss in a Denuder h = 1 - 0.910exp(-7.54m) - 0.0531exp(-85.7m) - 0.0153exp(-249m) EAS 4/8803
Isokinetic sampling probe Optical Particle Counter Cyclone inlet Denuder Pump Assessing Particle Loss in a Denuder Ambient Aerosol or PSL EAS 4/8803
Particle Composition Monitor (PCM) “KB” Channel 1: NH3 Na+, K+, NH4+, Ca+2 Channel 2: HF, HCl, HONO, HNO3, SO2, HCOOH, CH3COOH, (COOH)2 F-, Cl-, NO3-, SO4=, HCOO-, CH3COO-, C2O4= Channel 3: EC, OC, “SVOC” EAS 4/8803
PM2.5 Mass from Teflon Filter Gravimetry Equilibration of Teflon filter samples in Class 1000 Clean Room [PM] < 1000/scf, T = 21 +-0.5 oC, RH = 33 +-3 % Mettler Toledo MT5 Electronic Micro-Balance Exp. DL = 1.2 +-0.02 mg; P = +- 0.4 % @ 1 mg; A = +-0.001 % {1-500 mg} EAS 4/8803
Effects of Water Vapor on PM2.5 Mass Dehydration of denuded Teflon filter samples (ch1), Griffin Jan-Jul 2002 EAS 4/8803
Size Selective Inlet (PM10) Size Selective Inlet (PM10) WINS Impactor WINS Impactor Quartz Filter Teflon Filter Air Flow 16.7 Lpm Sampler Housing Pump Pump Mass, Elements by XRF OC/EC, SO42-, NO3-,NH4+ EPA’s FRM Samplers EAS 4/8803
PM10 Inlet PM2.5 Cyclone Fractionator PM2.5 Cyclone Fractionator 1 2 3 4 Manifold Manifold Air Flow MgO Denuder XAD-4 Denuder 7.3 Lpm 16.7 Lpm 16.7 Lpm 7.3 Lpm Quartz Filter Teflon Filter Teflon Filter Nylon Filter Mass, Elements by XRF Fine Particle Nitrate SO42-, NO3-, NH4+ OC/EC Pump Sampler Housing Andersen RAAS Sampler EAS 4/8803
Pump Sampler Housing 1 2 3 4 5 Empty Empty Quartz Filter Empty Quartz Filter Teflon Filter Teflon Filter Flow meter Flow meter Quartz Filter Quartz Filter Nylon Filter Flow meter Flow meter Flow meter 6.7 Lpm 6.7 Lpm 6.7 Lpm 6.7 Lpm 6.7 Lpm Air Flow MgO Denuder Empty Empty Empty Empty Spiral Impactor Spiral Impactor Spiral Impactor Spiral Impactor Spiral Impactor Replicate OC/EC Mass, Elements by XRF SO42-, NO3-, NH4+ Fine Particle Nitrate OC/EC Met-One SASS Sampler EAS 4/8803
MASS 400 MASS 450 Size selective Inlet (PM10) Size selective Inlet (PM10) Sampler Housing Sodium Carbonate Denuder WINS Impactor HNO3 OC/EC, SO42-, NO3-, NH4+ WINS Impactor Quartz Filter Air Flow 16.7 Lpm Pump Mass, Elements by XRF Teflon Filter Nylasorb Filter Volatilized Nitrate Pump URG MASS Sampler EAS 4/8803
Pump Sampler Housing Quartz Filter Teflon Filter Nylon Filter Quartz Filter Air Flow Na2CO3 Denuder 10 Lpm 10 Lpm 10 Lpm Impactor Impactor Impactor SO42-, NO3-, NH4-, OC, EC NO3- Mass, Elements R&P Speciation Sampler EAS 4/8803
Size Selective Inlet 33 Lpm VI VI = Virtual Impactor XAD-4 Denuder A 15 Lpm Na2CO3Denuder 15 Lpm Teflon Filter Air Flow 3 Lpm Sampler Housing B Teflon Filter A Quartz Filter Nylon Filter B Pump Pump Pump A. Mass, Elements by XRF B. NO3- A. SVOCs B. OC/EC, SO42-, NO3-,NH4+ Coarse Particle Mass URG VAPS Sampler EAS 4/8803
SEARCH/ARIES-PCM “EE” PM10 Cyclone PM10 Cyclone PM10 Cyclone 1 2 3 Na2CO3 Denuder CIF Denuder 16.7 Lpm Citric Acid Denuder PM2.5 Impactor 2-Stage Filter Pack Quart-Fiber Filter PM2.5 Impactor Flow Splitter 3-Stage Filter Pack Teflon Nylon Citric Acid Impregnated Solenoid Valves 1-Stage Nylon Flow Control & Pump Mass, Elements, SO42-, NO3-, NH4-, Volatilized NO3-, NH4-, SO42-, NO3-, NH4- OC, EC EAS 4/8803 Figure 3
Georgia Power Facilities; Jefferson Street Miami Maryland Delaware GIT Single Particle & Continuous Samplers SEARCH/ ARIES LIDAR Integrated Samplers Wind Profiler Atlanta Super-Site Experiment Aug’99 EAS 4/8803
70 60 50 40 Max Mean+SD Min Concentration, g/m3 30 Mean-SD 20 Mean 10 0 KB EE AND MET RPD URG RPS FRM-A FRM-B REL_REF FRM-Roof PCB(TVA) PCB (BYU) PM2.5 Mass Concentrations Comparison of Different Filter Samplers During ASSE 99 EAS 4/8803
PM2.5 Mass Concentrations Comparison of Different Filter Samplers During ASSE 99 Period Averages for Mass and Chemical Components for Time-Integrated Samplers Pearson Correlation Coefficients (r) for Test Samplers vs Relative Reference Solomon et al., JGR, 2003 EAS 4/8803
70 60 50 40 g/m3 30 20 10 0 8/3/99 8/5/99 8/7/99 8/9/99 8/13/99 8/15/99 8/17/99 8/19/99 8/21/99 8/23/99 8/29/99 8/31/99 8/11/99 8/25/99 8/27/99 FRM-A FRM-B AND MET URG RPS RPD KB PCB(TVA) PCB(BYU) Relative Ref. EE ASSE 99 – PM2.5 Mass EAS 4/8803
20 18 16 14 12 10 g/m3 8 6 4 2 0 8/3/99 8/5/99 8/7/99 8/9/99 8/11/99 8/13/99 8/15/99 8/17/99 8/19/99 8/21/99 8/23/99 8/25/99 8/27/99 8/29/99 8/31/99 FRM-A AND MET URG RPS VAPS KB PCB(TVA) PCB(BYU) MOUDI Relative Ref. EE ASSE 99 – PM2.5 Sulfate EAS 4/8803
7 6 5 4 3 g/m3 2 1 0 8/3/99 8/5/99 8/7/99 8/9/99 8/11/99 8/13/99 8/15/99 8/17/99 8/19/99 8/21/99 8/23/99 8/25/99 8/27/99 8/29/99 8/31/99 FRM-A AND MET URG RPS VAPS KP PCB(TVA) MOUDI Relative Ref. EE ASSE 99 – PM2.5Ammonium EAS 4/8803
1.4 1.2 1.0 0.8 0.6 g/m3 0.4 0.2 0.0 8/7/99 8/9/99 8/3/99 8/5/99 8/11/99 8/13/99 8/15/99 8/17/99 8/19/99 8/21/99 8/23/99 8/31/99 8/25/99 8/27/99 8/29/99 FRM-A AND MET URG RPS VAPS KP PCB(TVA) PCB(BYU) MOUDI Relative Ref. EE ASSE 99 – PM2.5Nitrate EAS 4/8803
Why Nitrate Scatter? Three Potential Artifact Reactions 2 NO2 + H2O HNO3 + HONO Surface mediated hydrolytic reaction, disproportionating N(IV) to N(III) + N(V) NO2 + Salkaline NO2-surface Reductive surface conversion of NO2 to nitrite NO2-surface + O3 NO3-surface + O2 Secondary surface oxidation of nitrite to nitrate Plus volatility HNO3 + NH3 NH4NO3 EAS 4/8803
18 15 12 g/m3 9 6 3 0 8/3/99 8/5/99 8/7/99 8/9/99 8/11/99 8/13/99 8/15/99 8/17/99 8/19/99 8/21/99 8/23/99 8/25/99 8/27/99 8/29/99 8/31/99 FRM-A AND MET URG RPS VAPS KB PCB(TVA) PCB(BYU) MOUDI (w/o AF) MOUDI (w/AF) Relative Ref. EE ASSE 99 – PM2.5 Organic Carbon EAS 4/8803
7 6 5 4 3 g/m3 2 1 0 8/3/99 8/5/99 8/7/99 8/9/99 8/11/99 8/13/99 8/15/99 8/17/99 8/19/99 8/21/99 8/23/99 8/25/99 8/27/99 8/29/99 8/31/99 FRM-A AND MET URG RPS VAPS KB PCB(TVA) PCB(BYU) MOUDI Relative Ref. EE ASSE 99 – PM2.5 Elemental Carbon EAS 4/8803