Download

1 / 57
600 likes | 893 Views
Linda Young POLS 400 International Political Economy Wilson Hall – Room 1122. The New Global Economic Order. Fall 2005. What is Autarky?. Policy of national self-sufficiency. Matter of degree. Examples?. Economic Integration from…. Trade (goods and services)

E N D
Linda Young POLS 400 International Political Economy Wilson Hall – Room 1122 The New Global Economic Order Fall 2005
What is Autarky? • Policy of national self-sufficiency • Matter of degree • Examples?
Economic Integration from… Trade (goods and services) • Level of trade, scope (more services) • Rules for trade – Implications for domestic policy Multinational Corporations (MNC) Foreign Direct Investment (FDI) Capital Flows Multilateral Institutions • Rules: trade, exchange rates • Imposition of particular philosophy And migration of labor
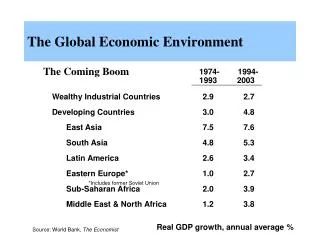
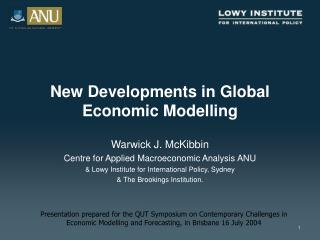
Three Waves of Globalization Source
History “Globalization” Waxes and Wanes • Could change again • Failure of state – expanded markets – expandedstate etc. First Wave: 1870-1914 • transport costs (sail to steamships), tariffs • Railways enabled land-intensive exports • Foreign capital stock rose – developing countries • Exports share of world income 8%
Retreat to Nationalism: 1914-1945 Technology continued to reduce transportation costs, but Great Depression: Protectionism • Diverted demand to domestic markets • United States: Smoot-Hawley tariffs, retaliation • US imports fell 30%; exports 40% between 1929-1933 • High income countries imposed capital controls
Second Wave: 1945-1980 Bretton Woods institutions Trade liberalization Further reductions in transport costs, communications Restored North-South pattern of trade: • Manufactures for primary commodities • Did not restore capital flows or immigration North-North trade increased much more
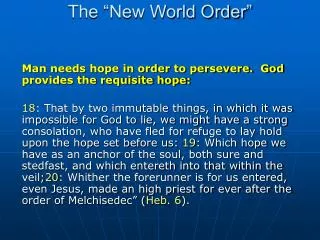
International Institutional and Policy Framework in the Bretton Woods Era Source
Globalization Post 1980 Developing Country Change of Policy Foreign Investment • Improved climate • Reduced barriers Transport Costs: Containerization and Airfreight • More countries in a supply chain Improved Communications • Manage and control by MNC “Death of Distance” • Just in time technologies
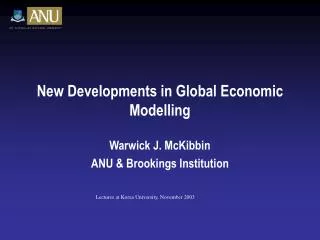
Importance of Trade Share of international trade in total output (exports plus imports of goods relative to GDP): – Developed countries: 32 to 38% between 1990 and 2001 – Developing countries 34 to 49% (same period) – Varies a lot between countries (Bordo) Total real exports in 1997 was14 times that of 1950 – while economic activity increased by 6 times (Greico)
Historical World Merchandise Exports, 1950–2002 Index1995 = 100 Additional Information
History of Tariffs 1875-1913: average tariffs increased – United States: average 38% for 1871-1913 WW2: about 40% (Greico) 1950s: tariffs remained at 20%, and also quotas, ER controls, currency restrictions Currently: 4% for manufactures, variable foragriculture 6-15%
Pre - Uruguay Post - Uruguay 1875 1913 1931 1950 Round Round France 12 - 15 20 30 18 – – Germany 4 - 6 17 21 26 – – Italy 8 - 10 18 46 25 – – United Kingdom 0 0 n.a. 23 – – European Union – – – – 5.7 3.6 Canada n.a. 26 n.a. – 9.0 4.8 United States 40 - 50 44 48 14 4.6 3.0 Average Tariffs on Imported Manufactured Goods (%) Source
ITO/GATT ITO: Not adopted – U.S. Congress in opposition However, maintained as a secretariat for nearly 50 years (1948-1995) Twenty-three of the founding members decided to reduce tariffs: Australia, Belgium, Brazil, Burma, Ceylon, Chile, China, Cuba, Czechoslovakia, France, India, Lebanon, Luxembourg, Netherlands, New Zealand, Norway, Pakistan, Southern Rhodesia, Syria, South Africa, United Kingdom, and the United States Eight rounds completed, now Doha
World Trade Organization In 1994, after seven years of negotiations, the Uruguay Round Agreement (URA) was signed This formalized the WTO Functions: • Provides rules to govern trade • Removes obstacles through negotiations • Provides stability • Resolves disputes
WTO Members • 147 members • 75% are developing countries • more countries in accession • WTO run by member governments • Decisions by consensus • Ministerial conferences held every 2 years All others 25% 75% Developingcountries WTO Countries
US Trade as a Percentage ofGross Domestic Product (GDP) US imports and exports of goods (percent of GDP) Additional Information
Exports Imports (billion dollars) World Merchandise Trade by Major Region, 2003 (Agriculture, mining [including fuels], and manufactures. ) North America$996 North America$1,552 Asia$1,734 Asia$1,897 Latin America$377 Latin America$366 Middle East$188 Middle East$290 Africa$165 Africa$173 Transition Economies$378 Transition Economies$400 Western Europe$3,173 Western Europe$3,141 World Total – $7,274 billion World Total – $7,557 billion Source
Who Do We Trade With? • Most US trade is with developed countries – about 61%(has implications for our discussions about wages) • About 40% from developing countries • Less likely than before to be commodities • Increase in manufactured imports • i.e., from Mexico 80% manufactured goods Source
Exports Imports OECD Countries’ Share of World Trade (Goods and Services, 2003) Non-OECD27% Non-OECD30% OECD Total73% OECD Total70% Note: OECD includes 30 countries with individual European members. Additional Information
Regional Trade Agreements and Exports(Percent of Total Exports) Note: APEC = Asia-Pacific Economic Cooperation EU = European Union NAFTA = North American Free Trade Agreement MERCOSUR = Mercado Comun del Sur (Common Market of the South) Additional Information
Trade in Services • Once considered non-tradable • Increasing part of US economy • Services trade growing quickly • In 1998, 40% of value of US merchandise exportsIn 1900, shipping and tourism 3% of US merchandise exports, now 16% • Service exports now include shipping and tourism (40% of total), royalties and fees, military transfers, education, finance, insurance, telecommunications, technical services are the fastest growing Source
World Exports of Merchandise and Commercial Services, 2003 Commercial Services $1,763 billion Merchandise $7,274 billion Source
Importance of Trade to Gross Domestic Product (GDP)of Least-Developed Countries (LDCs) 23% 22% Goods and Commercial Services 20% 18% 4% 3% Goods Commercial Services Additional Information
Why Does It Matter? Or Does It Matter? • Importance of trade in the economy • Impact on income • Transitions required-resource adjustment • Impacted by events far away-lack of control • Need to compete with other producers • Cultural homogenization • Potential risk-trade deficit
The World Bank Founded in 1944 – helped rebuild Europe after the war • First loan of $250 million was to France in 1947 for post-war reconstruction • Reconstruction has remained an important focus of the Bank’s work • Includes natural disasters, humanitarian emergencies, and postconflict rehabilitation needs
Structure of the Bank International Bank for Reconstruction and Development (IBRD) International Development Association International Finance Corporation Multilateral Investment Guarantee Agency International Center for Settlement of Investment Disputes
International Bank for Reconstruction and Development (IBRD), 1945 (the original bank) • Provides credit to middle-income and credit-worthy countries • 184 member countries • Raises most funds in financial markets • IBRD sells AAA rated bonds and other debt securities • Charges interest that reflects its cost of borrowing • Development impact not profit max • Positive income every year since 1948
Voting Power of the Largest Shareholders of the International Bank for Reconstruction and Development (IBRD) United States 16.4% Japan 7.87% Germany 4.49% France 4.31% Others 62.61% United Kingdom 4.31% Source
Relationship of Member Countries and the World Bank Group Member Countries Board of Governors Board of Executive Directors President Bank Group Management and Staff Source
World Bank Today One of the largest sources of development assistance: $17.3 billion in loans in 2001 • Largest external funders of education, against HIV/AIDS, health and one of the largest funders of biodiversity Now working in 100 countries Owned by 180 member countries • Members are shareholders who make decisions
The IMF Central institution of the international monetary system: a system of international payment and exchanges rates that enable business to take place between countries Attempts to prevent crises by encouraging adoption of “sound” economic policies, and by providing funds to address balance of payments problems.
Functions of the IMF • Surveillance • Promote exchange rate stability • Annual consultations • Expansion of economic variables evaluated • Policy advice • Lending • Nature of lending changed • First, short term, balance of payments • Then, long term, structural adjustment • Now, also debt relief lending- conditional
IMF Functions con’t • Technical assistance • Helped Baltic nations set up treasury systems for central banks • Dialogue – international discussion of policies, involved in almost all countries • Strengthen legal, regulatory and supervisory framework of banks • Review minimum capital requirements for banks • Core set of international accounting standards
Where Does IMF Get Its Money? From quota (capital) subscriptions that countries pay when they join the IMF (184 member countries) Quotas determine: • Countries’ payments • Voting power • How much they can borrow U.S. has 17.14%, Seychelles is 0.004 % of quotas
Board of governors: all 184 member countries represented, but vote in proportion to their quota • Day-to-day work done by executive board (24 members)
United States – 17.14% Japan – 6.15% Other – 60.78% Germany – 6.01% France – 4.96% United Kingdom – 4.96% IMF Executive Directors and Voting Power Source
IMF Staff: International civil servants (responsible to the IMF) 2,800 employees from 13 countries 2/3 are economists!
International Capital Flows • Motivations: reduced barriers, desire of investors to diversify, new financial instruments • Categories: • Foreign direct investment (less volatile, about ¼ total now) • 10% or more of the publicly traded shared of an enterprise in another country • Establishment of a firm – lasting influence • Portfolio (stocks and bonds) • Cross border sales of bonds, money market accounts, purchase of foreign equity securities, financial derivatives such as future contracts and options • Bank deposits bank loans, short term in nature
Huge Increase Cross border transactions in bonds and equities: • 9% US GDP in 1980, 223% in 1998 • Average daily turnover was $1.5 trillion in April 1998, compared to $0.6 trillion in April 1989 • Overstates changes in ownership (trading and retrading of same securities)
Does It Matter?? Yes, Asian Financial Crises
What Are MNCs? • A Multinational Corporation (MNC) is an international corporation with headquarters in one country and branches in a wide range of developed and developing countries. • Examples include General Motors, Coca-Cola, Firestone, Philips, Volkswagen, British Petroleum, and Exxon.
Role of Multinationals Important since the East India company In 1914, only a few MNCs – even in 1970s, not as important Now, 60,000 parent operations and 500,000 foreign affiliates– 25% of global output US based MNCs account for 19% of US GDP– Account for 63% of US goods exports and 40% imports
Does It Matter? Ability of big companies to influence governments
Foreign Direct Investment (FDI) Mostly FDI complements trade in goods (does not substitute) – MNCs are conduits for trade • In 1994, 36% of U.S. exports were intra-multinational transactions (sales to affiliates abroad) also, 43% imports • Exposes services to international competition • Can deliver services through sales by foreign affiliates • Increases competition in sectors difficult to exchange across borders
Global Flows of FDI Flows increased – from US$324 billion 1995 to US$1.5 trillion in 2000 Largest form of private capital inflow into developing countries
![Globalization, Global Security, and the New World [Dis]Order](https://cdn4.slideserve.com/1177374/slide1-dt.jpg)