Download
1 / 13
130 likes | 264 Views
The Global Economic Environment. The Coming Boom. 1974- 1993. 1994- 2003. Wealthy Industrial Countries 2.9 2.7 Developing Countries 3.0 4.8 East Asia 7.5 7.6 South Asia 4.8 5.3 Latin America 2.6 3.4 Eastern Europe* 1.0 2.7 Sub-Saharan Africa 2.0 3.9

E N D
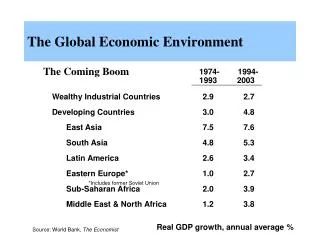
The Global Economic Environment The Coming Boom 1974- 1993 1994- 2003 Wealthy Industrial Countries 2.9 2.7 Developing Countries 3.0 4.8 East Asia 7.5 7.6 South Asia 4.8 5.3 Latin America 2.6 3.4 Eastern Europe* 1.0 2.7 Sub-Saharan Africa 2.0 3.9 Middle East & North Africa 1.2 3.8 *Includes former Soviet Union Real GDP growth, annual average % Source: World Bank, The Economist
Economic Systems • Capitalist • Socialist • Mixed
Economic Freedom An economic index with consideration of:
Country Income Segmentation High Income (Advanced Countries) - Triad - Others Upper Middle Income (NIC's) Lower Middle Income (DC's) Low Income (LDC's) + $9,385 + $3,036 + $765 < $765
National Production Gross National Product (GNP) Gross Domestic Product (GDP)
Drawbacks of GNP and GDP Uncounted Transactions Question of Growth Problem of Averages Pitfalls of Comparison
Purchasing Power Parity Estimate of GNP Per Capita at PPP (Selected Countries) PPP Estimate of GNP Per Capita (U.S. = 100) Selected Country GNP Per Capita United States Switzerland Japan Canada Russia Mexico Nigeria India 26,980 40,630 39,640 19,380 2,240 3,320 260 340 26,980 25,860 22,110 21,130 4,480 6,400 1,220 1,400
The Expanding Triad GNP Per Capita GNP (billion) Population (million) 1997 figures N. American Free Trade Area $ 8,354 393 $ 21,248 30% 7% U.S., Canada, Mexico % of World: Japan and the Tigers $ 5,638 $ 19,831 284 21% 5% Hong Kong, Japan, Malaysia, Singapore, South Korea, Taiwan, Thailand % of World: European Economic Area $ 8,293 $ 22,134 374 30% 7% % of World: EU: Austria, Belgium, Denmark, Finland, France, Germany, Greece, Ireland, Italy, Luxembourg, Netherlands, Portugal, Spain, Sweden, U.K. EFTA: Iceland, Switzerland
Big Emerging Markets: 1997 % of World Population % of World GNP % of World PPP Market GNP (billion) GNP Per Capita BEM (Total) $4,248 $1,388 15 29 52 CEA (Total) 1,318 1,046 5 12 22 China 890 723 3 11 21 Taiwan 268 12,263 1 1 <1 Hong Kong 160 25,225 1 <1 <1 Brazil 590 3,591 2 3 3 Korea, Rep. 512 11,218 2 2 1 India 352 365 1 4 17 Mexico 318 3,323 1 2 2 Russian Federation 301 2,018 1 2 3 Argentina 297 8,336 1 1 1 Turkey 184 2,896 1 1 1 South Africa 134 3,096 1 1 1 Indonesia 133 667 1 2 3 Poland 108 2,770 <1 1 1
Big Emerging Markets: 2010 % of World Population % of World GNP % of World PPP Market GNP (billion) GNP Per Capita BEM (Total) $7,673 $2,082 19 35 51 CEA (Total) 2,724 1,853 7 17 21 China 1,952 1,357 5 15 20 Taiwan 512 21,115 1 1 <1 Hong Kong 259 34,837 1 <1 <1 Korea 925 18,212 2 2 1 Brazil 877 4,384 2 3 3 India 665 544 1 5 17 Mexico 545 4,389 1 2 2 Argentina 501 12,023 1 2 1 Russian Federation 466 2,976 1 2 2 Turkey 330 4,117 1 1 1 Indonesia 230 948 1 3 3 South Africa 208 3,679 1 1 1 Poland 201 4,864 1 1 1
BOP (Balance of Payments) 1. Definition 2. Double entry system + (inflow) • (outflow)
BOP (cont’) 3. Current Account vs. Capital Account 4. Trade Balance
Ex: U.S. BOP, 1994-1997 (US$B) Trade Deficit Reserve