Download
1 / 19
190 likes | 318 Views
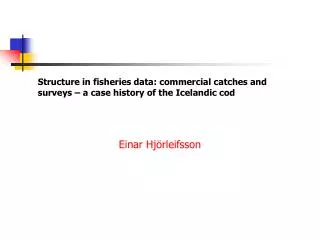
Investigating the Accuracy and Robustness of the Icelandic Cod Assessment and Catch Control Rule. A. Rosenberg, G. Kirkwood, M. Mangel, S. Hill and G. Parkes MRAG Americas, Inc. Background.

E N D
Investigating the Accuracy and Robustness ofthe Icelandic Cod Assessment and Catch Control Rule A. Rosenberg, G. Kirkwood, M. Mangel, S. Hill and G. Parkes MRAG Americas, Inc.
Background “Estimating the number of fish in the sea is just the same as counting the number of trees in a forest, except you can’t see the fish and they move.” J. G. Shepherd
Background to the Problem Total catch and national TACs 1977 to 2001. 1977 to 1990 calendar years; 1991 January to August; 1992 to date September to August.
Background to the Problem • Up to 2000, stock assessments of Icelandic cod have been carried out using the Extended Survivors Analysis (XSA) method. This method has been used extensively by many ICES working groups. • The 2000 ICES assessment showed that the stock had been seriously overestimated in recent years. In May-June 2000 MRI asked a group of external experts led by Professor John Pope to review and re-analyse the assessment. • The main conclusion of the review was that the MRI assessment (XSA using a number of CPUE tuning series from the survey and the commercial fleets) was overly optimistic with regard to estimating stock abundance in recent years, but that the methodology applied was essentially sound • Several alternative methods gave results with lower abundance in recent years, but all of the methods show similar patterns in estimating stock abundance.
Comparison of the results of the review assessments of the Iceland cod with MRI output
Log catchability residuals from 2000 XSA analysis by ICES Working Group
Initial appraisal of the Problem Using data supplied by MRI, we have confirmed the appearance of strong retrospective patterns in XSA-estimates of stock abundance which suggest that stock abundances in the late 1990s were overestimated, and hence TACs were set too high.
Initial Conclusions • The retrospective patterns in the XSA results seem to be associated with clear patterns in estimated catchabilities for the commercial fleet and the research surveys, especially the catchabilities in 1997. • The results of MRI assessments, the Pope review and our analyses to date indicate that the assessment results (i.e. the overestimation of stock size in the late 1990s) are driven by the data available. • It is the interpretation of the observations that is critical in formulating scientific advice.
Planned Research There are two questions we are focussing on in our planned research: 1. Could the problem reasonably expect to have been foreseen on the basis of the observed patterns in the data? 2. Can advice be provided that would help to avoid a repeat of such problems in the future?
Planned Research To answer these questions, we are following two main areas of investigation: 1. Investigating patterns in the data that have given rise to the assessment outputs and how the assessment might be modified to be more robust to such patterns, and 2. Considering the plausibility of observations and assessment results and the concomitant formulation of scientific advice The overall aim is to provide advice on preventing unnecessary rapid management changes or increased conservation risks due to failure to account fully for uncertainty in the scientific advice for management of Icelandic cod.
Interim results - XSA Assessment • If only the research survey indices are used in the XSA stock assessment, the retrospective patterns are less prominent, but they are still present. • Preliminary simulation studies suggest that if the catchability residuals of the surveys are re-sampled to eliminate systematic trends and exceptional values in specific years, then the retrospective patterns suggesting overestimation of stock abundance are no longer present. • However, the preliminary simulation studies also suggest that it may be the overall trends in catchability residuals, rather than a single exceptional year (e.g. 1997), that led to the overestimation.
Interim results - plausibility of results • Simulation studies are being used to ask the question for each new observation over the period in question: how reasonable is that observation given our understanding of the biology of the stock, the operation of the fishery and previous assessments? • Initially, this is being done using a stochastic Schaefer-type production model for two reasons: • Production models are easier to manipulate that more complicated models such as XSA or time series analyses, and • Pope’s analysis has shown that this type of model gives a reasonably good fit to the dynamics of age 4+ cod. • The model is still under development. It has not yet been carefully tuned to match Icelandic cod data as closely as possible; this will be done in the next phase of the analysis
Example output - plausibility of results • The graph depicts the distribution of the expected productivity of stocks (the ratio N(t+1)/N(t)), based on assumed stock dynamics for Icelandic Cod • It shows that annual production in excess of 10% has about a 15% probability, in excess of 20% is possible, but not very likely (about an 8% probability), and in excess of 40% is very rare indeed (about 1.5% probability).
Example output - plausibility of results Output of the 2000 XSA assessment showing estimated annual production (N(t+1)/N(t)) over the period 1972 to 1999
Example output - plausibility of results • This graph depicts the distribution of the actual productivity of stocks, as estimated by the XSA assessment for the period 1972 to 1999 • It indicates that the XSA analysis estimated that annual production of more than 20% happened almost 20% of the time (compared to 8% from the production model analysis)
Year-Round Closed Areas Atlantic Cod Spring NMFS Survey Distributions 8
Issues Related to Natural Mortality • Lifespan and literature guide choice of average natural mortality rate • Small variations without trend not problematic, trends and larger variation can affect annual advice • Changes in M with age affect estimates of optimal fishing patterns and calculations of reference points • Simulations guide likely impacts on advice