Download
1 / 27
270 likes | 281 Views
This study analyzes data on the Icelandic cod stock to assess its development, predict catch numbers, and provide short-term advice. It includes components such as landings, catch per unit effort, stock assessments, otoliths, logbooks, surveys, and indices.

E N D
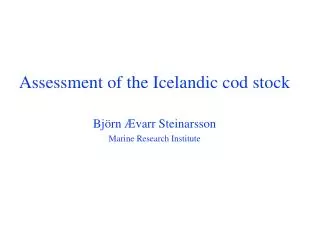
. Assessment of the Icelandic cod stock Björn Ævarr Steinarsson Marine Research Institute
Data Data analysis Assess. Prediction Components of advice(short-term) Landings Catch in numbers Length meas. Predicted developm. of stock and catch Otoliths CPUE Stock assessment Logbooks Surveys Indices Otoliths Length m.
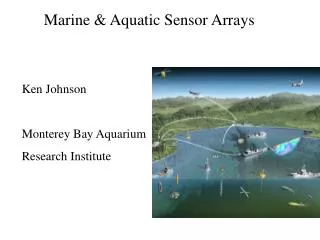
Input data • Catch in numbers by age groups • Survey indices • Catch per unit effort (CPUE) from the fleet
Sampling from landings • Allocation • Samples alloced proportional to landings in each fleet category - Real time. • Implementation • MRI staff • Inspectors from the Fisheries Directorate • The Coast Guard • Magnitude • Annually about 150.000 length measurements and 15000 otoliths for ageing.
CodCatch in number by age groups CV 20
Icelandic Groundfish SurveyIGFS • Annually about 600 fixed trawl stations taken in March all around Iceland since 1985. • Performed by 4-5 identical trawlers • Standarized trawl, trawling distance, trawling speed etc. • About 50 000 length measured and 5 000 otoliths taken for ageing • Gutted and ungutted weight, liver weight, gonad weight, stomach content anlysis, maturity etc.
IGFS- Primary objectives - • Independent estimate of relative abundance. • Annual indices of recruitment. • Various biological parameters.
IGFSTotal biomass index CV 10-16
Survey abundance vs number alive in the sea Number of fish of age a in the sea Number of fish of age a in survey
Distribution of Logbooks records herring Capelin Herring Shrimp trawl Bottom trawl Pelagic trawl Dragnót Longline
LogbooksObjectives • Collecting data to estimate CPUE/Effort • Behavior of the fishing fleet • Relationship with fishermen
CPUE vs Biomass Biomass (tonnes) CPUE (tonn/hour)
CODCatch in numbers 1991-2000 (Millions) Yearclass 1988
CODIGFS index vs. VPA estimate of age group 6 120 2 R = 0.8513 90 100 80 89 86 60 VPA 85 95 91 40 88 96 87 93 97 20 94 92 0 0 20 40 60 80 100 120 IGFS-Index
COD Estimated 4+ biomass by different assessment models.
COD Probability plots of estimated fishable biomass in 2002-2005