Download
1 / 11
110 likes | 133 Views
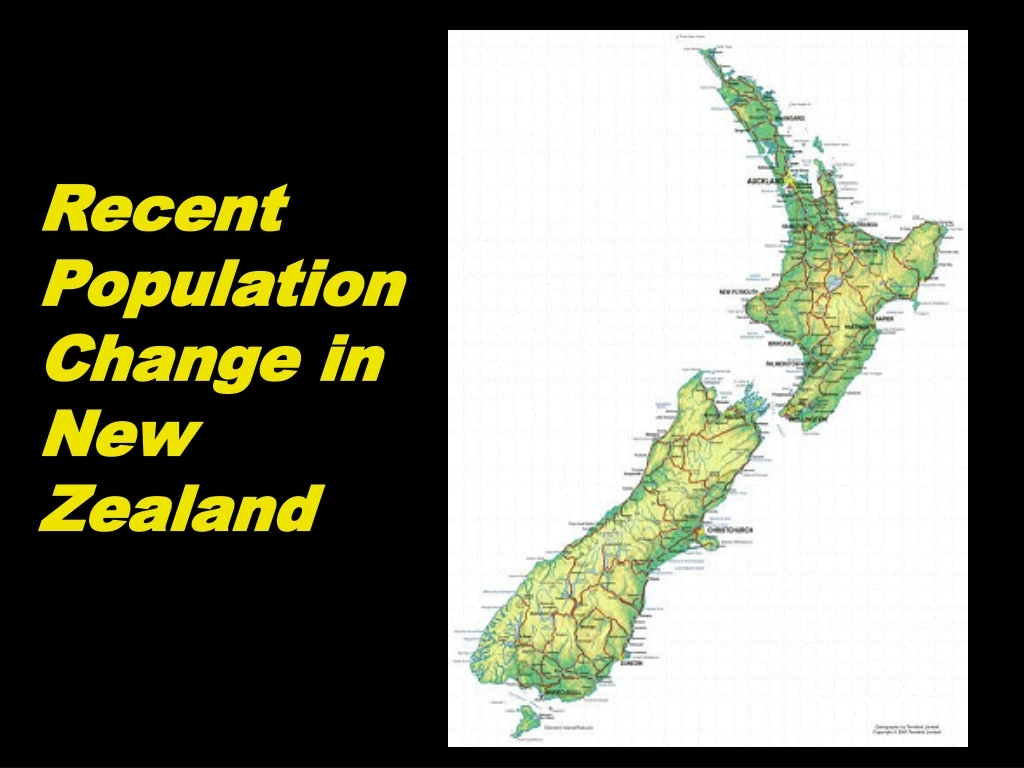
Explore the dynamic changes in New Zealand's population growth since 1945, from high birth rates to net migration impacts. Understand the factors shaping demographics over the last six decades.

E N D
for any country: Population Growth= (B – D ) + (I– E ) Births B = ? D = ? B – D = ? I = ? E = ? I – E =? Deaths Natural Increase Immigration Emigration Net Migration
The contribution of natural increase to population change in New Zealand since 1945 The death rate has fallen only slightly during the last sixty years. Therefore, changes to the birth rate have been the main factor influencing the rate of natural increase during this period. Refer to the resource sheet “Contribution of Natural Increase and Net Migration to Growth” and the next slide: Identify the years since 1945 when New Zealand’s birth rate was (a) higher, and (b) lower than average.
N.Z.'s birth rate at 44-year high(Feb 18, 2008) • Last year saw the highest number of births in the country since the baby boom years. • There were 64,044 babies registered by the end of December, the highest number since 1963. • The year ending December 1961 saw the highest number of births recorded in New Zealand, with 65,390 registered. • The Government Statistician, Geoff Bascand, reported that the fertility rate was now 2.2. • Over the last 30 years the fertility rate had remained at approximately 2.0. • In contrast, during the post-war years of 1948 to 1967 the fertility rate averaged 3.8, with the rate peaking at 4.3 in 1961. • Last year's figures showed women aged 30 to 34 years old had the highest fertility rate - 127 births per 1000.
The median age of New Zealand women giving birth was just above 30 and has been relatively stable since 2002. • The median age of women giving birth to their first child was 28 years in 2007. • A newborn girl could look forward to a life spanning 81.9 years, and a boy to a life of 77.9 years. • Deaths registered in the year ending in December totalled 28,520, of which 320 were infant deaths. • The infant mortality rate was 4.9 per 1000 last year, down from 6.5 per 1000 in 1997.
The contribution of net migration to population change in New Zealand since 1945 Net migration has had a major influence on New Zealand’s rate of population growth at different times during the last sixty years. Refer to the resource sheet “Contribution of Natural Increase and Net Migration to Growth” and the next two slides: Identify the years since 1945 when New Zealand experienced (a) net migration gains, and (b) net migration losses.
Net Permanent and Long Term Migration 1993 - 2007 30000 24000 18000 12000 6000 0 93 94 95 96 97 98 99 00 01 02 03 04 05 06 07 Arrivals Departures Net Migration