Download
1 / 1
20 likes | 148 Views
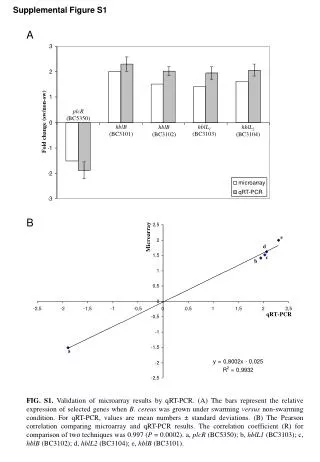
This study presents the validation of microarray results through qRT-PCR for selected genes in Bacillus cereus, specifically comparing expression levels under swarming (sw) versus non-swarming (non-sw) conditions. The relative expression values are shown as mean numbers ± standard deviations. Notably, the Pearson correlation coefficient (R) between microarray and qRT-PCR data was found to be 0.997 (P = 0.0002), demonstrating a strong correlation between the two techniques. The key genes analyzed include plcR (BC5350) and various hbl genes (BC3101, BC3102, BC3103, BC3104).

E N D
A e Microarray d c b plcR (BC5350) Fold change (sw/non-sw) hblB (BC3101) hblL1(BC3103) hblB (BC3102) hblL2(BC3104) qRT-PCR a B Supplemental Figure S1 FIG. S1. Validation of microarray results by qRT-PCR. (A) The bars represent the relative expression of selected genes when B. cereus was grown under swarming versus non-swarming condition. For qRT-PCR, values are mean numbers ± standard deviations. (B) The Pearson correlation comparing microarray and qRT-PCR results. The correlation coefficient (R) for comparison of two techniques was 0.997 (P = 0.0002). a, plcR (BC5350); b, hblL1 (BC3103); c, hblB (BC3102); d, hblL2 (BC3104); e, hblB (BC3101).