Seismic Sleuthing
Seismic Sleuthing. Michael Fornasiero DAEE – RPI 4/1/2009. Background. October 4 th , 2006 North Korea announces plans to test a nuclear weapon. October 9 th , the People’s Republic of China notifies the US that a test is imminent.


Seismic Sleuthing
E N D
Presentation Transcript
Seismic Sleuthing Michael Fornasiero DAEE – RPI 4/1/2009
Background • October 4th, 2006 North Korea announces plans to test a nuclear weapon. • October 9th, the People’s Republic of China notifies the US that a test is imminent. • 20 minutes after a warning was received seismographs of the USArray pickup signals of a seismic event to the west. • More data is becoming available from IRIS (Incorporated Research Institutions for Seismology)
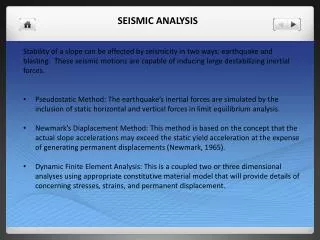
Task • Analyze the data to find the epicenter of the seismic event. • The epicenter location could be beneficial for satellite surveillance. • Determine if the event could have been natural or from a nuclear test. • Could the event be from an earthquake, mine collapse, or nuclear blast.
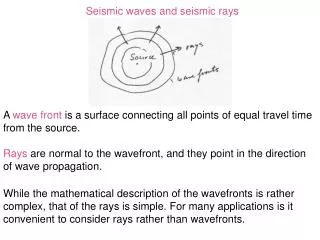
Seismic Data • The following represents actual data collected from seismographs near the epicenter of the event. • Some of interpretation may already be performed for you to aid in understanding of the seismograph charts.
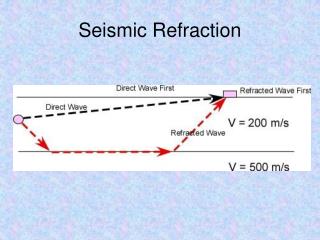
Location 1 Station: MDJ - Mudanjiang, Heilongjiang Province, ChinaNetwork: IC - New China Digital Seismograph NetworkLat: 44.62 Lon: 129.59 Elev: 270.00 Event Name: 20061009_013527.0.spyder The 1st vertical line on each plot will be the P-Wave and the 2nd vertical line will mark the S-Wave time. From this chart you determine that the difference in travel times between the P and S Waves is 40 seconds. Refer to the enclosed wave travel time chart to determine distance from station. Epicenter Distance (km)__________ 375
Location 2 Station: INCN - Inchon, Republic of KoreaNetwork: IU - Global Seismograph Network (GSN - IRIS/USGS)Lat: 37.48 Lon: 126.62 Elev: 80.00 Event Name: 20061009_013527.0.spyder Data from this station suggests a difference in travel times between the P and S Waves of approximately 60 seconds. Epicenter Distance (km)__________ 500
Location 3 Station: MAJO - Matsushiro, JapanNetwork: IU - Global Seismograph Network (GSN - IRIS/USGS)Lat: 36.55 Lon: 138.20 Elev: 405.00 Event Name: 20061009_013527.0.spyder A colleague has contacted you about their recording. He has determined that the P-Wave was detected at 1:37:27 UTC and the S-Wave at 1:39:17 UTC. What is his distance from the epicenter? Epicenter Distance (km)____________ 950
More Questions How long will it take the P-Wave to travel from the epicenter to East Greenbush if the distance is around 10,000km between locations? P-Wave Travel Time_____________ If the P-wave was felt at 10:48:00 UTC when did the seismic event occur? Time of Event___________ 00:12:50 10:35:10
Plotting the Event 41.7° N Point 1 – Latitude________ Longitude________ Point 2- Latitude_________ Longitude________ 127.3° E 41.3° N 129.1° E From the help you gave to your colleague in Japan you find out that the epicenter is East of 128° Longitude. With this information you now know the source of the seismic disturbance.
Determining the Cause of the Disturbance • Now that we know the location of the seismic event we can start to figure out what caused the disturbance. • We need to look at; • The seismic history of the area • The form of the seismograph signal • The location itself and its surroundings
Seismic History of the Site • The epicenter is marked with a star. • The scale represents levels of seismic activity in the area. (0-low,5-high) • Looking at the scale and the star’s location is this an area of active seismic activity?
Form of the Signal A – Pakistan B – India C – Soviet Union D – North Korea Red – Nuclear Tests Blue – Natural Earthquakes Image Courtesy: https://str.llnl.gov/Mar09/walter.html
The Location There is always some error in measurement, this shows up as a Radius of Uncertainty. Where do you think this error comes from? USGS Predicted: 41°16’ N 129°6’E Actual: 41°29’N 129°8’E
Results of Investigation • The device’s estimated yield was less than 1kt. • It is likely that the test failed to achieve an expected yield of 4kt. • Yet it is of note that North Korea participated in a Pakistani nuclear test in 1998, this could have boosted confidence in North Korean scientists to perform a test at less than full yield. • ISIS estimates North Korea is capable of producing 4-13 nuclear weapons, while at reduced yields could produce 7-35 weapons.
North Korea’s Capabilities • Tactical and Theatre Ballistic Missiles; • Nodong missile: 1,000kg nuclear weapon to 1,500km (covers all of Japan) • Taepo Dong I: 750kg nuclear weapon to 2,300km • Taepo Dong II: 300kg nuclear weapon to 6,000km (reach Alaska) • North Korea has also supplied many missile and weapon components to Iran and Pakistan.
Sources Johnston, W. R. “North Korea’s First Nuclear Test” OCT21,2006 <www.johnstonarchive.net> USGS Earthquake Hazards Program “Quake Details October 9 01:35:28 UTC” <www.earthquake.usgs.gov/…/ustqab/> Broadband Seismic Data Collection Center “October 8th, 2006 Magnitude 4.2MB Event From an Alleged Nuclear Test in North Korea” <www.eqinfo.ucsd.edu/…/index.php> Site Image <www.nrdc.org/media/docs/061013b.jpg> Ammon, C.J. and Thorne Lay “USArray Records the 9 October 2006 North Korean Nuclear Test” OCT23, 2006 Submitted to EOS Walter, Bill “Sleuthing Seismic Signals” S&TR March 2009 “Earth Quake Events 2006: IRIS” 3/25/2009 <www.iris.edu/news/special_2006.htm>