Scenario and Context
trajectories in different scales. different positions. 3D Hand Trajectory Segmentation by Curvatures and Hand Orientation for Classification through a Probabilistic Approach. Hand Orientation. GOALS : Automated System for Classification of 3D reach-to-grasp trajectories.

Scenario and Context
E N D
Presentation Transcript
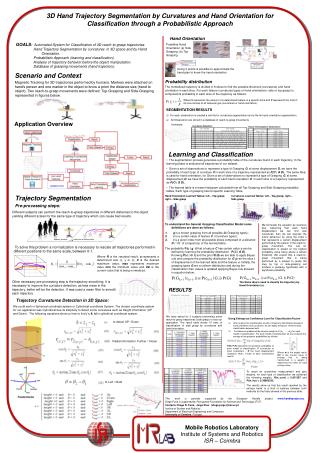
trajectories in different scales different positions 3D Hand Trajectory Segmentation by Curvatures and Hand Orientation for Classification through a Probabilistic Approach Hand Orientation GOALS: Automated System for Classification of 3D reach-to-grasp trajectories. Hand Trajectory Segmentation by curvatures in 3D space and by Hand Orientation. Probabilistic Approach (learning and classification). Analysis of trajectory behavior before the object manipulation. Database of grasping movements (hand trajectory). Possibles Hand Orientation (a) Side Grasping; (b) Top Grasping Using 3 points is possilbe to approximate the hand plan to know the hand orientation Scenario and Context Magnetic Tracking for 3D trajectories performed by humans. Markers were attached on hand’s person and one marker in the object to know a priori the distance size (hand to object). Two reach-to-grasp movements were defined: Top-Grasping and Side-Grasping represented in figures below. Probability distribution The normalized trajectory is divided in 8 slices to find the possible directions (curvatures) and hand orientation in each slice. For each fetaure (curvatures types or hand orientations: side or top grasp) is computed its probability in each slice of the trajectory as follows: Where fi represents the amount of a determined feature in a specific slice and F represents the total of all occurrences of all features type (curvatures or hand orientation). SEGMENTATION RESULTS • For each observation is created a xml file for curvatures segmentation and a file for hand orientation segmentation. • All Observation are stored in a database of reach-to-grasp movements • Application Overview Learning and Classification • The segmentation process generates a probability table of the curvatures found in each trajectory. In the learning phase is analyzed all trajectories of our dataset. • Given a set of observations to represent a type of Grasping G, at some displacement D, we have the probability of each type of curvature C in each slice of a trajectory represented as P(C | G D). The same Idea is used for hand orientation, for Given a set of observations to represent a type of Grasping G, at some displacement D, we have the probability of each hand orientation O in each slice of a trajectory represented as P(O | G D). • The learned table is a mean histogram calculated from all Top-Grasping and Side-Grasping probability tables. Each type of grasping has its specific Learning Table. Trajectory Segmentation Pre-processing steps: Hand Orientation Learned Tables: left – Top grasp; right – Side grasp Curvatures Learned Tables: left – Top grasp; right – Side grasp Different subjects can perform the reach-to-grasp trajectories in different distances to the object yielding different scales for the same type of trajectory which can cause bad results. • To understand the General Grasping Classification Model some definitions are done as follows: • gis a known grasping from all possible G (Grasping types); • c is a certain value of feature C (Curvature types); • i is a given index from all possible slicescomposed of a distanceD ( 1/8 of a trajectory) of the learned table. • The probability P(c | g i)that a feature C has certain value c can be defined by learning the probability distribution P(C | G D).Knowing P(c | G i) and the prior P(G) we are able to apply Bayes rule and compute the probability distribution for G given the slice iof displacement of the learned table and the feature c. Initially, the grasping types Gare a uniform distribution and during the classification their values is updated applying Bayes rule showed in equation below: We formulate the equation as recursive way. Assuming that each hand displacement we can find new curvatures, then we can express the online behaviour by using the index k that represents a certain displacement performed by the person in the reach-to-grasp movement. The rule for classification is based on the highest probability value being above a certain threshold. We expect that a reach-to-grasp movement that is being performed by a subject to grasp the mug by top or side-grasping will produce a grasping hypothesis with a significant probability. • To solve this problem a normalization is necessary to rescale all trajectories performed in different positions to the same scale, between 0-1. Where R is the rescaled result; a represents a determined axis (x, y or z); X is the desired maximum value; max represents maximum value min the minimum value and Val is the current value that is being normalized. • Other necessary pre-processing step is the trajectory smoothing. It is necessary to improve the curvature detection, as less noise in the trajectory, better will be the detection. It was used a mean filter to smooth each trajectory. The Same idea is used to classify the trajectory by Hand Orientation (o). RESULTS Trajectory Curvatures Detection in 3D Space: We could work in Spherical coordinate system or Cylindrical coordinate System. The chosen coordinate system for our application was Cylindrical due its simplicity to detect some curvatures such as Height information (UP and Down). The following equations show us how to find ( r, θ, h) in cylindrical coordinate system: We have asked for 2 subjects performing some reach-to-grasp trajectories (side grasp) to test our application. The result table shows 10 trials of classification of side grasp by curvatures and hand orientation. Using Entropy as Confidence Level for Classification Fusion • After analyze the classification results of trajectory classification based on hand orientation and curvatures, we can apply entropy to verify the best classification between both. • Confidence variables will be used as weight w Є {w1 , …, wN} for each model of classification. For each model of classification we can compute the entropy of the posterior probabilities as follows: to detect UP / Down Radial information: Further / Closer P(G| F D) represents the posterior probability of each model of classification. F (curvatures or hand orientation) ; D the hand displacement (trajectory slice); iindex of each classification results. Where w is the weight result; HC is the current value of entropy that is being transformed in a weight; i represents the index for each entropy value. Fusion To reach an uncertainty measurement and give weights, for each type of classification we achieved the following weights: P(w_curv) = 0.611367 and P(w_hor) = 0.38863252. The results show us that the result reached by the entropy belief is a kind of balance between both methods for the trials showed in the previous slide. θ: Left / Right This work is partially supported by the European Handle project: www.handleproject.eu. Diego Faria is supported by Portuguese Foundation for Science and Technology (FCT). Contacts: Diego R. Faria, Jorge Dias: {diego,jorge}@isr.uc.pt Institue of System and Robotics Department of Electrical Engineering and Computers University of Coimbra, Portugal.