January-December
440 likes | 634 Views
January-December. 2011 Results. Sound performance with key BP. 2011-2013 milestones reached. February 23rd 2012 // Madrid (Spain). Table of contents. 1. Period highlights. 2. January – December 2011 Results and KPIs. 2. 3. Outlook & Risks. 4. Conclusions. Period highlights.

January-December
E N D
Presentation Transcript
January-December 2011 Results Sound performance with key BP 2011-2013 milestones reached February 23rd 2012 // Madrid (Spain)
Table of contents 1. Period highlights 2. January – December 2011 Results and KPIs 2 3. Outlook & Risks 4. Conclusions
Period highlights Sound performance and Business Plan 2011-13 progress ► Sound profitability, fully aligned with market guidance, in a highly competitive market • Group sales and EBIT up 10% YOY, to EUR3,033 MM and 131MM EUR each • WTG EBIT margin of 4% and 2,802 MWe sold in 2011, up 16% YOY 3 • Wind farm EBIT of EUR26 MM and 417MW in sales agreements signed ► Order book of 1,600 MW (1) at December 2011, up 13% YOY ► Group NFD of EUR710MM, 2.0x group EBITDA, to accommodate investment plan, sales internationalization, manufacturing expansion and progress in wind farm activity ► Key milestones in CoE (2) optimization, growth and efficiency (BP 2011-13) reached during the year (1) Firm and irrevocable orders and confirmation of framework agreements received for 2012-2013 delivery (2) Cost of Energy
Period highlights Profitable growth in highly competitive markets WTG profitability in line with the company guidance range of 4% to 5% despite operating in an increasingly competitive environment 12.9% 11.8% 11.9% 12.0% ►10% growth in group sales and EBIT 3,033 4 2,802 2,764 ► Downward trend in WTG 2,405 margin due to: • Geographic sales mix 4.9% (inc. pricing pressure 4.3% 4.3% 4.0% in China) 2,802 3,033 • Ramp up of new 2,764 2,405 product platforms WTG EBITDA margin WTG EBIT margin Group EBITDA margin Group EBIT margin 2010 2011 2010 2011 Group sales EUR MM MWe sold
Period highlights Strong sales activity in the wind farm division Positive trend in the profitability of the wind farm division driven by the recovery of the construction and sales activity, with 417MW signed in 2011 2010 2011 17 5 7 6 4 3 0 Q1 10 Q2 10 Q3 10 Q4 10 Q1 11 Q2 11 Q3 11 Q4 11 -4 -6 EBIT EURMM
Period highlights 13% increase in YE order book 13% increase in YE order book (1) at December driven by Latin America, with 32% of the total order volume, and North Africa with 13% Order backlog December (MW) 6 1,600 13% 1,414 2010 2011 (1) Firm orders and confirmation of frame agreements for 2012-2013 delivery
Period highlights NFD increase to fund foundations of BP 2011-2013 Group NFD to EBITDA of 2.0x in line with guidance ► Q4 2011 cash inflow on wind farm and EUR810MM WTG deliveries 7 EUR710MM ► FY 2011 net debt increase to EUR607MM 2.3x accommodate: <2x Group EUR313MM 2.0x • BP2011-2013 investment needs 1.7x EBITDA • Geographic expansion of 0.9x commercial and manufacturing presence • Increasing seasonality in sales mix Q1 2011 Q2 2011 Q3 2011 Q4 2011 • Wind farm activity Group NFD NFD/EBITDA
Period highlights Key milestones BP 2011-2013: CoE optimization 1 ► Type certificate of G128-4,5 MW COST OF ENERGY: -10% to -15% (1) in 2011 ► Global launch of G97-2.0 MW • 356MW in firm orders signed up to 8 Dec. 2011 2 • >5% contribution to 2011 WTG sales GROWTH ► O&M services’ GPA • Targeting above market average availability of 99% • 10% reduction in operating costs 3 ► Launch of 4 new R&D centres (USA, EFFICIENCY India, Singapore, UK) (1) CoE reduction depending on product platform and market
Period highlights New market openings linked to CoE optimization(*) China Europe USA CoE 2009 CoE 2011 CoE 2009 CoE 2011 CoE 2009 CoE 2011 100 83/85 100 85/90 100 80/85 9 India Ramp up of G97-2MW driver of CoE reduction Brazil 2011 first year of operations (*) Customer’s CoE optimization from base 2009=100
Period highlights Key milestones BP 2011-2013: Growth 1 COST OF ENERGY ►16% growth in WTG MWe sold • 23 markets and 46+ clients • 57/43 sales ratio big utilities/spot market 2 10 GROWTH: • Order backlog up 13% YOY +10% consolidated sales growth in 2011 16.300 MW under maintenance and new value added O&M services launched • GPA, LCR, 3rd party’s fleet, life extension programmes 417MW in wind farm sales agreements signed 3 EFFICIENCY
Period highlights Key milestones BP 2011-2013: Efficiency Adjustment of capacity to demand and 1 localisation of supply chain COST OF ENERGY • 43% reduction in blade capacity in Spain since 2009 • Capacity transformed into O&M and Big Components Repair Centers 11 2 GROWTH • Indian market served with 65% localised local (for G5x-850 KW) Maximising flexibility & optimising investment through Make & Buy strategy • Significant advances for blades and casting Reduction of overheads • 5% reduction in structure costs/MWe sold 3 EFFICIENCY: Reduction of construction and logistic costs Flat group margins YOY • OTD up to 97.6% (from 95%)
Period highlights Gamesa Venture Capital: Investing in Sustainable Growth Capitalizing on our …to achieve financial and strategic returns resources… 12 Mission: Provide industrial and financial support to high growth Market Position & potential and technology intensive early stage companies worldwide Customers Main objetives: Build and manage a profitable portfolio of companies with significant synergies with Gamesa. Integrated Supply Focus in key sectors: Solar, eMobility, marine energy, energy efficiency, small-wind and offgrid solutions Chain Current Portfolio: N2S: Energy Efficiency and eMobility WorldWater: Small scale desalination and water treatment New Product Development SkyBuilt: Solar based offgrid and distributed generation
Table of contents 1. Period highlights 2. January – December 2011 Results and KPIs 13 3. Outlook & Risks 4. Conclusions
Wind Turbine Generation Division 14
2011 results and KPIs Wind Turbine Generators - Financial Statements EUR MM 2010 2011 Var. 11/10 Q4 11 Sales 2,623 2,875 +9.6% 865 MWe 2,405 2,802 +16.5% 837 15 EBITDA 338 340 +0.6% 101 EBITDA/Sales 12.9% 11.8% -1.1p.p. 11.7% EBIT 127 116 -8.8% 19 EBIT/Sales 4.9% 4.0% -0.9p.p. 2.2% Net Income 64 61 -4.3% 6 NI/Sales 2.4% 2.1% -0.3p.p. 0.7% NFD -405 273 273 NFD/EBITDA -1.2x 0.8x +2.0x 0.8x
2011 results and KPIs Wind turbine generators - Activity 15% increase in deliveries and the reduction of Ex-works highlight management effectiveness during 2011 Evolution of MWe sold 16 2,802 2,405 o WIP increase to accommodate sales and 15% manufacturing internationalization 3,092 2,685 -138 497 -787 -142 2010 2011 Var.WIP (2) Ex-works (1) Delivered (1) Stock variation of invoiced finished products available for delivery (2) Stock variation of non-invoiced finished products 16
2011 results and KPIs Wind turbine generators - Activity India and Latin America key drivers of growth in 2011 Increasingly diversified Geographic mix (MWe sold) 17 geographic mix Latin America and South Cone 28% 28% treble its contribution while 23% 22% 20% India more than doubles it 19% 15% 14% 8% 7% Europe, including Spain, remain 8% 5% 3% stable 1% Spain USA China India Latam & Rest of RoW Low gas and PPA prices South Europe negatively impact US demand Cone 2010 2011
2011 results and KPIs WTG - Profitable delivery in a highly competitive market Wind turbine EBIT margin of 4.0%, within the committed guidance, in a highly competitive market thanks to Gamesa’s flexible structure and strict cost focus 12.9% 11.8% 18 2,802 Gross margin negatively impacted by • A highly competitive environment 2,405 • Pricing pressure in China 4.9% 4.0% • Compensated partially by O&M 2,802 service margin improvement 2,405 EBITDA margin (1) EBIT margin (1) 2010 2011 MWe sold (1) Wind Turbine Division
2011 results and KPIs WTG - Solid financial position Net debt increase YOY, in line with guidance, to accommodate BP2011-13 investment needs and sales and manufacturing internationalization Strong decrease of net debt and EUR MM working capital in Q4 on the back of 19 sales delivery and intra-company payments Working capital ratio of 24% due to 24% -EUR405MM • Partial localization of new manufacturing EUR273MM hubs in India and Brazil • Increasing sales internationalization -1% • Grid connection delays in China 2010 2011 Capex of EUR229MM in 2011 Net financial debt Working capital as % of sales
2011 results and KPIs Wind Farms - Financial Statements Increasing sales, with 417MW signed in 2011, show Gamesa’s commitment to the wind farm business value realisation plan 21 EUR MM 2010 2011 Q4 2011 Strong sales activity in the year Sales 432 534 300 with 417MW in sales agreements signed and 177MW delivered EBITDA -1 35 27 Positive EBIT impacted by the EBIT 0 26 17 recovery in construction and sales activity NI -5 1 2 NFD 196 438 438
2011 Results and KPIs Wind Farms - Activity 417 MW in sales agreements signed of which 177MW already delivered (1) Activity progress (MW) The recovery of the sales activity 734 22 continues in Q4 2011 with sales agreements signed for 131MW in Spain, France, Germany and 396 US. 364 370 230 Increase of MW under 166 construction, reaching 370 in Q4, in USA and Europe in line with the strategy of value realization of Final stages – MW under MW commissioned Gamesa Energía. Total MW construction 2010 2011 (1) Excluding Chinese and Indian wind farms.
2011 Results and KPIs Wind Farms - Evolution of NFD Increasing NFD levels to accommodate strong sales activity with deliveries in 2012 A 2-year cash investment cycle FY11 NFD of 23 EUR438 MM FY10 NFD of EUR196 MM Q1 08 Q2 08 Q3 08 Q4 08 Q1 09 Q2 09 Q3 09 Q4 09 Q1 10 Q2 10 Q3 10 Q4 10 Q1 11 Q2 11 Q3 11 Q4 11
2011 results and KPIs Consolidated group - Financial Statements MM EUR 2010 2011 Q4 2011 Sales 2,764 3,033 1,018 2,623 2,875 865 WTG Wind Farms 432 534 300 Adjustments (290) (376) (147) 25 EBIT 119 131 49 WTG 127 116 19 EBIT Margin 4.9% 4.0% 2.2% Wind Farms 0 26 17 Adjustments (8) (11) 13 50 51 22 Net Income NFD -210 710 710 NFD / EBITDA -0.6x 2.0x 2.0x WTG -405 273 273 Wind Farms 196 438 438 25
Table of contents 1. Period highlights 2. January – December 2011 Results and KPIs 26 3. Outlook & Risks 4. Conclusions
Outlook and risks Market outlook Wind power competitiveness to outweigh current uncertainties in the long term Short term demand of wind installations impacted by • Impact of uncertain world economic outlook on energy demand especially in the US and Europe 27 • European and US deficits’ impact on renewable support programmes • Clients’ liquidity constraints Long term double-digit growth Wind installations CAGR 2011-15 supported by wind power increasing 20% competitiveness and government 17% 16% commitments to renewable targets: 10% to 10% 20% CAGR2011-2015 depending on source BTM GWEC MAKE IEA
Outlook and risks Market outlook Near-term growth supported by emerging wind markets: India, Latin America and Africa 28 Source: GWEC, Wind Market Report 2010
Outlook and risks Regulatory and government support outlook Regulatory volatility negatively impacting medium term demand in mature markets: USA and Southern Europe, but 20/20/20 targets in place SHORT TERM MEASURES LONG TERM TARGETS SOUTHERN EUROPE SOUTHERN EUROPE 29 Spain: RD1/2012: moratorium on new renewable Spain: 35GW of wind in 2020 installations not included in the Register of Pre- assignment. Portugal: 31% renewable energy Portugal: Award of any new generation capacity for from total energy consumption supplying electricity (inc. renewables) suspended. Italy: 12 GW of wind power in Italy: Change of Green Certificates for FiT regime for 2020 wind farms built 2013 onwards and for all wind farms after 2015. Moratorium to wind installations in some regions. AMERICA AMERICA USA: State RES in place in 29 USA: Expiry of PTC/ITC (USD22/MWh) at the end of states and 8 states have goals 2012
Outlook and risks Regulatory and government support outlook But solid commitment from emerging markets: Asia ASIA India: Shift from accelerated depreciation to GBI (INR 0.5/kWh) and REC (1.5-3.9 INR) China: 2020 Target: 150-200GW of wind power. 4FiT categories, ranging from 0.51RMB/KWh to 30 0.61RMB/KWh Japan: 2020 Target: 10% of its energy coming from renewables. Subsidies halted and waiting for FiT to be determined. Currently, prices are based on a spot price plus a REC/MWh generated. Australia: 2020 Target: 20% of its energy coming from renewables. REC system (now called LGCs). LGC price: c.42AUD/MWh with ceiling at 65AUD/MWh. Thailand: 2022 Target: 25% of its energy coming from renewables (800MW of wind). Supplement to normal electricity tariff with a premium granted during 10 years. 2 types: 4.5 baht/kWh for projects below 50 MW and 3.5 baht/kWh for projects over 50 MW. Government considering introducing FiT. South Korea: Combines a FIT with capital and tax incentives. FIT to be replaced by a Renewable Portfolio Standard in 2012. Can host CDM projects. Plans to launch carbon-emissions trading system in 2015.
Outlook and risks Regulatory and government support outlook But solid commitment from emerging markets: Latin America and Africa LATIN AMERICA Brazil: Tender system. Next auction: A-3 auction will be held 22nd March 2012. Mexico: Target: 4.5GW of renewable energy by 2012, 7GW by 2014 but no generic regulation 31 (FiT or REC) for renewables. Chile: Target: 20% of its energy coming from renewables. 5% of power distributed by utilities comes from renewables and will increase 0.5% p.a. until reaching 10% in 2024. Peru: Renewable energy tenders every 2 years (next auction: 2013). Government forecasts USD33m investment in wind energy until 2020. AFRICA South Africa: 2030 Target: 8.4GW of wind power. Tender system since August 2011. 634MW awarded in August auctions. Next auction: March 2012. Egypt: 2020 Target: 7.2GW of wind power (5GW to come from private investors). Projects tendered through competitive bids and FiT planned for 2012.
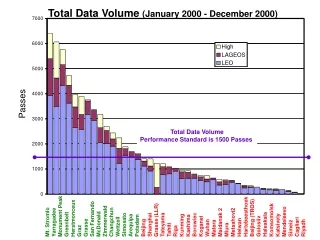
Outlook and risks CoE outlook The COE of an average onshore wind farm will be fully competitive with traditional energy sources by 2016(1) AVERAGE TURBINE HUB HEIGHT (METRES) 80 32 60 40 20 1980 1990 2000 2010 AVERAGE TURBINE POWER CURVE 1984 - 2011 (%) 100% 75% 2011 1984 50% 25% 0% 0 5 10 15 m/s Source: The Economics of Wind Energy, EWEA Report 2009; Bloomberg New Energy Finance (1)
Outlook and risks Program launched to prop up the BP 2011-13: CoE and growth 2 1 GROWTH COST OF ENERGY Intensify commercial efforts Focus on increasing reliability and availability of exiting platforms, 33 • In new markets: South Africa, Middle East, and reduce cost of materials South East Asia/Australasia, • New product development: • With new utilities in Northern and Central G97cII-2 MW and G114-2 Europe MW Internationalisation of O&M services New O&M services (GPA) targeting Value realisation of Gamesa Energia pipeline 99% availability in Gamesa´s worldwide fleet • Focus on US market Life extension of wind turbines 3 EFFICIENCY
Outlook and risks Program launched to prop up the BP 2011-13: efficiency to remain critical Continue capacity adjustment to demand • From capacity reduction to capacity consolidation and product adaptation in Spain • Complete localisation of supply chain in India and Brazil • Adaptation of capacity to new G9X-2 MW in China, linked to cost reductions 34 Optimization of construction and logistic costs • Central logistics department to standardise processes and optimise purchases to reduce costs • Reduction of construction times through WOSS (1) • Reduction of storage costs New procurement tools to be displayed through the organisation to simplify homologation process, speed procurement times and reduce procurement costs Overhead reduction target (-15% OH/MWe sold) in place 3 EFFICIENCY (1) Wind farm Optimized Supply Sequence
Outlook and risks 2012 Guidance Bringing free cash flow break even to 2012 WTG WTG Guidance 2011 2011 Guidance 2012 Manufacturing MWe sold 2,800-3,100 2,802 2,800–3,200 35 EBIT Margin 4.0%-5.0% 4.0% 2.0% - 4.0% WC as % of sales 15%-20% 24% 20%-25% Capex 250 229 275(2) Windfarm Development & Sales Wind Farms (1) MW delivered(3) c.400 177 c.400 EBIT (MMEUR) c.20 26 c.0 Net debt (EUR m) c.500 438 c.250 Group NFD/EBITDA <2x 2.0x <2.5x FCF Breakeven (1) 2011 guidance included wind farm delivered to Iberdrola (244MW) ahead of planned scheduled (Q1 2011) at client’s request. (2) 2012 is peak year of capex in BP 2011-2013 (3) Excluding Chinese joint promotion agreements
Outlook and risks Understanding 2012 volume outlook Gamesa to prioritise balance sheet strength and profitability to sales volume 1,600 MW Healthy order flow, up 13%YOY at December +13% 2011, driven by Latin America and South Cone (+514 1,414 MW MW) and North of Africa (+201 MW) 36 2012 sales volume impacted by Gamesa’s priority for balance sheet strength and profitability in the context of: • Slow down in US demand ahead of PTC expiration • Grid connection delays and liquidity constraints in China • Short term demand volatility linked to regulatory Dec. 2011 Dec. 2010 changes in India Next year delivery Delivery 2012-13
Outlook and risks Understanding 2012 WTG margin outlook Ramp up of new product platforms and geographical manufacturing bases, part of BP 2012-2013, impact negatively on 2012 WTG margin Smaller (-) impact in Increasing (+) Increasing (+) (?) impact in 2013 2013 impact in 2013 impact in 2013 37 4,0 2-4 2011 mg% Market mix New production ramp-up Product mix Cost optimization 2012 mg% Emerging markets’ W-W ramp up of new New products’ Operational increasing G9x-2MW platform, (i.e.G97-2,0 MW) Efficiency programs contribution to and G10X- 4,5 MW contribution to sales group sales industrialization
Table of contents 1. Period highlights 2. January – December 2011 Results and KPIs 38 3. Outlook & Risks 4. Conclusions
Conclusions Delivering our commitments in a complex market Solid delivery in line with guidance committed to the market • WTG EBIT margin of 4% and 2,802 MWe sold in 2011, up 16% year-on-year • Wind farm EBIT of EUR26 MM and 417MW in sales agreements signed. • Group NFD of EUR710MM, 2,0x group EBITDA 39 at December 2011, up 13% year-on-year Order book stood at 1,600 MW (1) Key milestones of the BP 2011-13 reached during the year • 10% to 15% reduction in CoE through new product platforms and O&M services (2) • 10% group sales growth through commercial and O&M service expansion • Increasing cost efficiency through capacity adjustments; localization of supply chain; progression on Make & Buy strategy and reduction of construction, logistics costs and overheads 2012 financial guidance brings forward free cash flow breakeven while continuing carrying through the actions encompassed in the Business Plan (1) Firm and irrevocable orders and confirmation of FAs at Dec. year N for delivery in 2012-2013 (2) Cost of Energy optimization depending on product platform and geography
Conclusions Operational flexibility, strict cost control and commercial internationalization are key for short term performance From challenges Continuous economic weakness in the Western world impacting energy demand Regulatory uncertainty, driven by budget deficits, impacting wind installation in key markets (US, Southern Europe, India). Delays in grid connection in China 40 Overcapacity continues to promote aggressive competitive practices among some peers Into opportunities Well diversified (country and client) sales base, wind farm activity and increasing role of O&M service sales minimizes impact of single market downturns Flexible approach to manufacturing (Make & Buy and supply chain localization) reduces cost exposure to sudden changes in demand and optimize capex investment Strict cost focus and early capacity adjustment to demand (first USA and now Europe) protect group profitability and allow for EBIT margin above industry average R&D investment, fully linked to clients’ CoE reduction needs, guarantees return on investment
Conclusions Corporate responsibility: Much more than numbers 2011 Payroll- Geographic Distribution 67 2010 (3) 2011 (3) Var. 431 Spain 920 People 7,262 8,357 15% USA China International staff 36% 42% 6 p.p. India 1.156 Permanent contracts 6,316 7,315 16% 41 Brasil 4.853 RoW Health and safety 930 Frequency index 4.19 3.84 (8%) (1) Severity Index 0.12 0.09 (25%) (2) 2011 Payroll- Gender distribution Environment ISO 14.001 Centers 47 47 - CO2 emission reduction (t) 31,250,850 36,214,350 16% 23% Male Female (1) Nº of accident leaves per million hours worked 77% (2) Nº of work days lost due to accidents per 1,000 hours worked (3) Figures not audited
Conclusions Aligned with the main international ethical corporate principles Commited with the human rights and the environment 42 Included in the leading sustainability indexes 42
Disclaimer “This material has been prepared by Gamesa Corporación Tecnológica, S.A., and is disclosed solely as information. This material may contain declarations which constitute forward-looking statements, and includes references to our current intentions, beliefs or expectations regarding future events and trends that may affect our financial condition, earnings and share value. These forward-looking statements do not constitute a warranty as to future performance and imply risks and uncertainties. Therefore, actual results may differ materially from those expressed or implied by the forward-looking statements, due to different factors, risks an uncertainties, such as economical, competitive, regulatory or commercial changes. The potential investor should assume the fact that the value of any investment may rise or go down, and furthermore, it may not be recovered, partially or completely. Likewise, past performance is not indicative of future results. The facts, opinions, and forecasts included in this material are furnished as to the date of this document, and are based on the company’s estimations and on sources believed to be reliable by Gamesa Corporación Tecnológica, S.A., but the company does not warrant its completeness, timeliness or accuracy, and therefore it should not be relied upon as if it were. 43 Both the information and the conclusions contained in this document are subject to changes without notice. Gamesa Corporación Tecnológica, S.A. undertakes no obligation to update forward-looking statements to reflect events or circumstances that occur after the date the statements were made. The results and evolution of the company may differ materially from those expressed in this material. None of the information contained in this document constitutes a recommendation, solicitation or offer to buy or sell any securities, futures, options or other financial instruments or provide any investment advice or service. This material does not provide any recommendation of investment, or legal, tax or any other type of advise, and it should not be relied upon to make any investment or decision. Any and all the decisions taken by any third party as a result of the information, materials or reports contained in this document, are the sole and exclusive risk and responsibility of that third party, and Gamesa Corporación Tecnológica, S.A. shall not be responsible for any damages derived from the use of this document or its content. This document has been furnished exclusively as information, and it must not be disclosed, published or distributed, partially or totally, without the prior written consent of Gamesa Corporación Tecnológica, S.A. The images captured by Gamesa in the work environment or at corporate events are solely used for professional purposes to inform third parties about corporate activities and to illustrate them. English version prevails.”
Questions & Answers Muchas gracias Thank you 44 Û ȡ