Download
1 / 27
270 likes | 426 Views
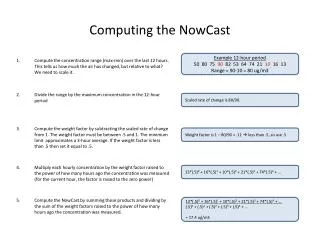
J. Ray jairay [at] sandia [dot] gov Sandia National Laboratories, Livermore, CA Acknowledgements: The work was funded by DoD /NCMI SAND2012-9575P. Assimilating HealthMap Data to Nowcast Epidemics.

E N D
J. Ray jairay[at] sandia [dot] gov Sandia National Laboratories, Livermore, CA Acknowledgements: The work was funded by DoD/NCMI SAND2012-9575P Assimilating HealthMap Data to Nowcast Epidemics Sandia National Laboratories is a multi-program laboratory managed and operated by Sandia Corporation, a wholly owned subsidiary of Lockheed Martin Corporation, for the U.S. Department of Energy's National Nuclear Security Administration under contract DE-AC04-94AL85000.
The Problem • Public health reports of disease’s progression are usually delayed • Takes time to do lab confirmations; Sentinel physicians reports have to be collated • 2 weeks delay (CDC); more in poorer countries • Unconventional, open-source reports of morbidity a lot more timely • Media & social media reports appear on the Web and are searched & curated by companies like HealthMap (HM) • Also, if it appears in media, the outbreak must be somewhat anomalous • Question: Can the timely HM data be used to cover up the 2 week lag in public health reports? • Called “nowcasting”
Outlines of a Solution • Make a correlative model between morbidity and HM data • Data/dependent variable (CDC): flu activity in US [weekly, time-series] • flu isolates and Sentinel physician reports collected by CDC • Independent variable (HM): # of media reports concerning flu in the region from HM [weekly, time-series] • Will exploit the correlation between CDC & HM and the autoregressive structure of the CDC time-series • Will check for • How small a region can we apply this model to? • How well could we do if we did not have HM data? • Under what conditions does HM data help?
Comparing Isolates and News Reports CDC +ve isolates plotted by date of collection News reports seem to treat the early 2009 flu activity as “business-as-usual” Huge jump around Week 70 (April 2009) But once primed, upsurges in media reports correspond to upsurges in CDC isolates But no proportionality here HM data much more jagged than CDC Weeks, starting 2008-01-01
How Much Correlation between CDC & HM? • Modest correlation of between log10(CDC) and log10(HM) • A linear model will give a good trend, but not accuracy • HM data will need smoothing • The spectral content of log-CDC and log-HM should be similar, if using linear model
Smoothing log-HM Data • Fourier decompose log-CDC and log-HM data • Plot A2 versus mode frequency • About 5-6 modes in log-CDC data • 5 point smoothing stencil applied repeatedly to log-HM • After 3 applications, similar spectral content
A Linear Model for the Trend • Propose: • Log-CDC = a * log-HM + b • Simple regression • Comes close – an approx. • CDC – HM discrepancy does NOT look like noise; rather correlated • Model discrepancy as a multivariate Gaussian – exploit smoothness / structure of CDC data • New Model = Linear model + discrepancy (modeled as a multiGaussian) • Such a model is constructed using Regression or Universal Kriging (RK/UK) The linear model gives worst errors between Weeks (20:40), (90:110).
UK with a predictive trend – Full US • Plenty good prediction • 2009 Swine Flu outbreak • Fair correlation ~0.67
Can We Break This Method? • Two ways of breaking kriging • Have a small time-series, so that we can’t make a good covariance model • Have a rough, non-smooth time-series, so that Gaussian-process assumptions don’t hold • So, • The method should break if applied early in the season OR • If the counts are small e.g., mild outbreak or small region • Test how small a region one can get away with • The mild 2011-2012 season
Smallest Region – New England • A very modest correlation exists for 2011-2012 season • Outcome: Incorporating HM data gives a good nowcast at 35 weeks • Go smaller – try to break model @ NYC
Even smaller – NYC, 2009 Swine Flu • Just works – with 10 weeks of data too!
Nowcasting without HealthMap Data • Fit CDC (ILINet) data with typical time-series model • Literature says autoregressive models work • Test with AR, ARMA and ARIMA models • Found that AR models, of order 4, work • Yt = a1*Yt-1 + a2*Yt-2 + a3*Yt-3 + a4*Yt-4 + w, w ~ N(0, s2) • Fit AR(4) models, predict and compare with HM-augmented predictions • Full US, 2009 swine flu epidemic • NYC, swine flu epidemic
Full US, 2009 Swine Flu Epidemic; Week 90 • Predictions w/o HM data nearly miss the last prediction w/ HM data w/o HM data
NYC only, Swine Flu; 14 Weeks of Data • Prediction w/o HM is pretty bad – missed the truth by a mile w/ HM data w/o HM data
ARX models • UK/RK was chosen since we had working software • But we can also use ARX models • ARX = auto-regressive with exogenous inputs • y = observed variable (log10(ILINet)), x = log10(HM), e = noise • ARX models need to • Search over (L, M) for a good fit AND • Use AIC to choose between models with different (L, M) AND • Ensure that (ai, bj) provide a stable model • In the following results, the ILINet data “chooses” (L, M) • i.e. predictions with 75 & 110 weeks of data have different (L, M)
Full US, Swine Flu – 75 weeks of data • The ARX method is better UK method ARX method
Full US, Swine Flu – 110 weeks of data • About the same UK method ARX method
NYC, Swine Flu epidemic – 11 weeks of data • Kriging seems better, but it has bigger uncertainty bounds UK method ARX method
NYC, Swine Flu epidemic – 14 weeks of data • ARX better (tighter uncertainty bounds) UK method ARX method
Conclusions • Adding HM data helps • At the US scale and when ILINet data is available as a long time-series, HM data helps a bit • At NYC scale, when the ILINet data time-series is short, HM data is utterly critical. • Why? • Time-series methods (autoregressive, moving average etc) require one have a long time-series to learn the model • Wasn’t available for NYC (only 18 weeks of data found) • In its absence, we need a “crutch” to do predictions – Twitter/Google Flu Trends / HM data etc. • Assimilation of HM data can be done with UK or ARX models • Performance about the same, but ARX models have better provable properties
2011-2012 Season: 25 Weeks Limit, Full US • 2011-2012 outbreak was mild • Few HM reports • Outcome: Works fine • Try a smaller region, not full US
Interim Conclusions • The method works for the full US for a media-rich epoch • i.e. 2009 swine flu era, with lots of media coverage • Works too, for the mild 2011-2012 season; little media coverage • Works for small populations – New England and even NYC • Assimilating HM data helps • When one has short CDC time-series (and not much data to extract structural info) • NYC is an example • When the CDC fails to show correlated behavior • And the HM-dependent trend is all we can do