Image Segmentation
Shengnan Wang shengnan@cs.wisc.edu. Image Segmentation. Contents. Introduction to Segmentation Mean Shift Theory What is Mean Shift? Density Estimation Methods Deriving the Mean Shift Mean Shift Properties Application Segmentation. Intelligent Computing & Control Lab


Image Segmentation
E N D
Presentation Transcript
Shengnan Wang shengnan@cs.wisc.edu Image Segmentation
Contents • Introduction to Segmentation • Mean Shift Theory • What is Mean Shift? • Density Estimation Methods • Deriving the Mean Shift • Mean Shift Properties • Application • Segmentation Intelligent Computing & Control Lab School of Electrical Engineering at SNU
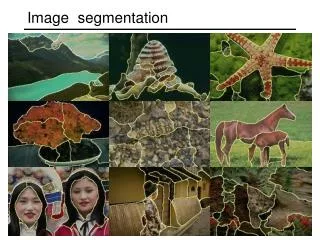
Motivation • What do we see in an image? • How is the image represented? • Goal: Find relevant image regions for the objects we want to analyze
Image Segmentation • Definition 1: Partition the image into connected subsets that maximize some “uniformity” criteria. • Definition 2: Identify possibly overlapping but maximal connected subsets that satisfy some uniformity
Other Applications • Medical Imaging • Locate tumors and other pathologies • Measure tissue volumes • Computer-guided surgery • Diagnosis • Treatment planning • Study of anatomical structure • Locate objects in satellite images (roads, forests, etc.) • Face Detection • Machine Vision • Automatic traffic controlling systems
Methods • Clustering Methods -K means, Mean Shift • Graph Partitioning Methods -Normalized Cut • Histogram-Based Methods • Edge Detection Methods • Model based Segmentation • Multi-scale, Region Growing , Neural Networks, Watershed Transformation
Point-Cluster distance single-link clustering complete-link clustering group-average clustering Dendrograms(Tree) yield a picture of output as clustering process continues Segmentation as clustering • Cluster together (pixels, tokens, etc.) that belong together • Agglomerative clustering • attach pixel to cluster it is closest to • repeat • Divisive clustering • split cluster along best boundary • repeat * From Marc Pollefeys COMP 256 2003
Mean Shift Segmentation • Perhaps the best technique to date… http://www.caip.rutgers.edu/~comanici/MSPAMI/msPamiResults.html
Mean Shift Theory Intelligent Computing & Control Lab School of Electrical Engineering at SNU
Region of interest Intuitive Description Center of mass Mean Shift vector Objective : Find the densest region Distribution of identical billiard balls
Region of interest Intuitive Description Center of mass Mean Shift vector Objective : Find the densest region Distribution of identical billiard balls
Region of interest Intuitive Description Center of mass Mean Shift vector Objective : Find the densest region Distribution of identical billiard balls
Region of interest Intuitive Description Center of mass Mean Shift vector Objective : Find the densest region Distribution of identical billiard balls
Region of interest Intuitive Description Center of mass Mean Shift vector Objective : Find the densest region Distribution of identical billiard balls
Region of interest Intuitive Description Center of mass Mean Shift vector Objective : Find the densest region Distribution of identical billiard balls
Region of interest Intuitive Description Center of mass Objective : Find the densest region Distribution of identical billiard balls
1. What is Mean Shift? • Non-parametric density estimation Assumption : The data points are sampled from an underlying PDF Data point density implies PDF value ! Assumed Underlying PDF Real Data Samples Intelligent Computing & Control Lab School of Electrical Engineering at SNU
Data 1. What is Mean Shift? • A tool for: Finding Modes in a set of data samples, manifesting an underlying probability density function(PDF) in RN Non-parametric Density Estimation Discrete PDF Representation Non-parametric Density GRADIENT Estimation (Mean Shift) PDF Analysis Intelligent Computing & Control Lab School of Electrical Engineering at SNU
2. Density Estimation Method • Kernel Density Estimation Intelligent Computing & Control Lab School of Electrical Engineering at SNU
2. Density Estimation Method • Kernel Density Estimation • - Various kernels Intelligent Computing & Control Lab School of Electrical Engineering at SNU
Kernel Density Estimation Gradient 3. Deriving the Mean Shift Give up estimating the PDF ! Estimate ONLYthe gradient Using the Kernel form: Function of vector length only Define : Size of window
Computing The Mean Shift Gradient Kernel Density Estimation
Computing The Mean Shift Yet another Kernel density estimation ! Simple Mean Shift procedure: • Compute mean shift vector • Translate the Kernel window by m(x) • repeat
Mean Shift Mode Detection What happens if we reach a saddle point ? Perturb the mode position and check if we return back Updated Mean Shift Procedure: • Find all modes using the Simple Mean Shift Procedure • Prune modes by perturbing them (find saddle points and plateaus) • Prune nearby – take highest mode in the window
Real Modality Analysis Tessellate the space with windows Run the procedure in parallel
Real Modality Analysis The blue data points were traversed by the windows towards the mode
Mean Shift Algorithm • Mean Shift Algorithm • Choose a search window size. • Choose the initial location of the search window. • Compute the mean location (centroid of the data) in the search window. • Center the search window at the mean location computed in Step 3. • Repeat Steps 3 and 4 until convergence. The mean shift algorithm seeks the “mode” or point of highest density of a data distribution:
4. Mean Shift Properties • Automatic convergence speed – the mean shift vector size depends on the gradient itself. • Near maxima, the steps are small and refined • Convergence is guaranteed for infinitesimal steps only infinitely convergent, (therefore set a lower bound) Adaptive Gradient Ascent Intelligent Computing & Control Lab School of Electrical Engineering at SNU
4. Mean Shift Properties • Advantages : • Application independent tool • Suitable for real data analysis • Does not assume any prior shape (e.g. elliptical) on data clusters • Can handle arbitrary feature spaces • Only ONE parameter to choose • h (window size) has a physical meaning, unlike K-Means • Disadvantages : • The window size (bandwidth selection) is not trivial • Inappropriate window size can cause modes to be merged, or generate additional “shallow” modes Use adaptive window size Intelligent Computing & Control Lab School of Electrical Engineering at SNU
Mean Shift Segmentation • Mean Shift Segmentation Algorithm • Convert the image into tokens (via color, gradients, texture measures etc). • Choose initial search window locations uniformly in the data. • Compute the mean shift window location for each initial position. • Merge windows that end up on the same “peak” or mode. • The data these merged windows traversed are clustered together. *Image From: Dorin Comaniciu and Peter Meer, Distribution Free Decomposition of Multivariate Data, Pattern Analysis & Applications (1999)2:22–30
Discontinuity Preserving Smoothing Feature space : Joint domain = spatial coordinates + color space Meaning : treat the image as data points in the spatial and range (value) domain Image Data (slice) Mean Shift vectors Smoothing result Mean Shift : A robust Approach Toward Feature Space Analysis, by Comaniciu, Meer
z y x Discontinuity Preserving Smoothing The image gray levels… … can be viewed as data points in the x, y, z space (joined spatial And color space)
z y Discontinuity Preserving Smoothing Flat regions induce the modes !
The effect of window size in spatial and range spaces Discontinuity Preserving Smoothing
Segmentation Segment = Cluster, or Cluster of Clusters Algorithm: • Run Filtering (discontinuity preserving smoothing) • Cluster the clusters which are closer than window size Image Data (slice) Mean Shift vectors Segmentation result Smoothing result Mean Shift : A robust Approach Toward Feature Space Analysis, by Comaniciu, Meer http://www.caip.rutgers.edu/~comanici
Mean Shift SegmentationResults: http://www.caip.rutgers.edu/~comanici/MSPAMI/msPamiResults.html
Intelligent Computing & Control Lab School of Electrical Engineering at SNU
Intelligent Computing & Control Lab School of Electrical Engineering at SNU
K-means Mean Shift Max Entropy Threshold Normalized Cut