Download
1 / 38
380 likes | 512 Views
Climate Diagnostics of Large Fires in the Upper Colorado River Basin. Nick Nauslar M.S. Student/Research Assistant Department of Atmospheric Sciences University of Nevada, Reno & Desert Research Institute. Climate and Wildfires.

E N D
Climate Diagnostics of Large Fires in the Upper Colorado River Basin Nick Nauslar M.S. Student/Research Assistant Department of Atmospheric Sciences University of Nevada, Reno & Desert Research Institute
Climate and Wildfires Climate fluctuations heavily impact length and severity of fire season. Southern Oscillation Index have teleconnections with western US climate. Scientists research other indices to identify connections to fire season.
Climate and Wildfires • Fire season in the western US: May through October (94% of fires & 98% of acres burned). • 50-80% of precipitation in the West falls from October to March. • Peak fire season during July and August (climatologically hottest and driest months).
General Colorado Fire Climate • Areas dominated by dry shrubs and grasslands depend on climate conditions 10-18 months before fire season. • Colorado Rockies show wet (dry) conditions previous year contributing (inhibiting) fuel loading. • Wet (dry) conditions during current year suppressing (enhancing) fire activity by moistening (drying) fuels.
Why Investigate? • Costs: ~$500 million, 80,000+fires burning 3.5 million acres • Loss of life and property • Better prediction and information can lead to more efficient and productive fire management
Upper Colorado River Basin (UCRB) I-70 UTAH Grand Junction I-25 COLORADO
UCRB Climate • Region varies greatly with precipitation and temperature values and from season to season • Yearly snowfall from 12 in. to 200+ in. and total precipitation from 8 in. to 20+ in • Average high and low temperatures as much as 25° different for the year
UCRB Fuels • Varies greatly from east to west • Fine (grasses and shrubs) to heavy (Aspen and conifer trees) fuels • Fine fuels react quicker to weather/climate changes. Easier to ignite and burn when dry • Heavy fuels react slower to weather/climate changes. Burn longer and produce crown fires (very destructive)
Palmer Drought Severity Index (PDSI) • Chose to investigate relationship between PDSI and anomalous fire season severity. • PDSI- Autoregressive measure of combined precipitation, evapotranspiration, and soil moisture conditions. • Represents accumulated precipitation anomalies and to a lesser extent temperature anomalies.
Standard Precipitation Index (SPI) • SPI- Number of standard deviations that observed value would deviate from the long-term mean for normally distributed random variable • Single numeric value assigned to precipitation accumulation • Can compare across different climate regions
PRISM Data • PDSI and SPI values are from Parameter-elevation Regressions on Independent Slopes Model (PRISM) data • Uses point measurements of precipitation, temperature, and other climatic factors • Produces continuous, digital grid estimates of monthly, yearly, and event-based climatic parameters • 4 km grid that accounts for topography and its effects
PDSI and SPI PRISM Data • Devised a FORTRAN program that mapped the closest PRISM data point and retrieved the average monthly value • Obvious drawbacks: if fire occurred early in the month and only using one data point
Arctic Oscillation (AO) • Dominant pattern of non-seasonal sea-level pressure (SLP) variations north of 20°N • Characterized by SLP anomalies of one sign in the Arctic and the opposite sign centered about 37°-45°N • Below normal Arctic SLP (warm phase) and above normal Arctic SLP (cold phase) • Leading mode of Empirical Orthogonal Function (EOF) analysis
Pacific/North American Pattern (PNA) • Based on analysis of Rotated Principal Component Analysis (RPCA) • Process identifies primary teleconnection patterns for all months • Daily PNA for last 120 days • Each daily value standardized by standard deviation of monthly index from 1950-2000 • Positive phase -> higher heights near Hawaii and over intermountain west
Oceanic Niño Index (ONI) (El Niño 3.4 Region) • Based on +/- 0.5°C threshold for ONI • ONI- 3 month running mean of sea surface temperature (SST) anomalies (5°N-5°S and 120°-170°W) • Warm Phase-> El Niño, Cold Phase-> La Niña
Multivariate ENSO Index (MEI) • Comprised of variables over tropical Pacific • SLP, surface wind (u, v components), SST, surface temperature, and cloudiness • Calculated from 1st Principal Component
Spearman Rank Correlation (SRC) • Values between -1 and 1 • Rank data in pairs • More robust and resistant than Pearson’s r • Statistically significant dependent on data and final results • Set for α=.05, Confidence Interval= 95%
Principal Component Analysis (PCA) • Purpose is to reduce a data set with many variables to fewer variables but still representing most of the data • 1st PC explains most variance • Subsequent PC’s explain less and less variance and are uncorrelated to each other
PDSI Histogram • PDSI negative for all fires • However, majority of large fires occurred during near-normal conditions (-1.9 to 1.9)
PDSI and SPI Summary • Deficit precipitation in 3 and 6 month SPI • SPI 1 could be higher than normal due to previous suggestions • SPI 12 month and PDSI near normal • Possibly a buildup fuels with near or above normal precipitation then adequate shorter term drying = large fires • Stays in line with previous studies
Climate Pattern Summary • Correlations show statistically significant connection between winter and summer months • Fall and winter months in Niño patterns important, explain most of the variance • PNA inconclusive although spring and summer seem to have some connection • AO appears to have connection in winter months
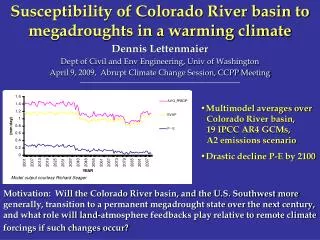
Climate Pattern Summary • Winter patterns seem to have the most impact on following fire season • Explain most of the variance, studies show connection with some of these patterns and the Rockies Colorado Rockies Correlation (PDSI & acres burned) -0.5 0 0.5 -40 -30 -20 -10 0 Months before August
Conclusions • Near normal conditions further back with drought conditions closer to fire start • Large scale climate patterns show some promise of teleconnections (esp. ENSO) • Preliminary results are encouraging, merit further investigation • Investigate further back with indices • Perform more complete statistical analysis
References • “Climate and Wildfire in the Western United States”- Westerling, Gershunov, Brown, Cayan, and Dettinger, 2001 • “Statistical Forecast of the 2001 Western Wildfire Season Using Principle Components Regression” - Westerling, Gershunov, Brown, Cayan, and Dettinger, 2002 • “ENSO Influence on Intraseasonal Extreme Rainfall and Temperature Frequencies in the Continental United States: Observations and Model Results”- Gershunov, Barnett, 1998. • Wildland Fire Assessment System (WFAS) • Climate Prediction Center (CPC) • Program for Climate, Ecosystems, and Fire Applications (CEFA) • Western Regional Climate Center (WRCC) • ATMS 706: Data Analysis taught by Dr. Ryan Banta • National Interagency Fire Center (NIFC)