Download
1 / 26
260 likes | 405 Views
XMM fuel estimates. J. Martin European Space Agency (ESA) European Space Operations Centre (ESOC) 23 rd March, 2010. Menu. Background XMM Reaction Control System Fuel estimation Book-keeping PVT ( Pressure-Volume-Temperature : applying the Ideal Gas Law )

E N D
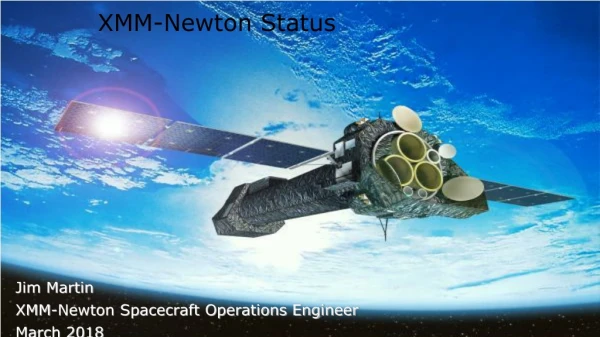
XMM fuel estimates J. Martin European Space Agency (ESA)European Space Operations Centre (ESOC) 23rd March, 2010
Menu • Background • XMM Reaction Control System • Fuel estimation • Book-keeping • PVT (Pressure-Volume-Temperature: applying the Ideal Gas Law) • Thermal Propellant Gauging Technique (TPGT) (thermal knocking) • Review and Way Ahead • Reference Documents
Background • On July 15, 2009, DP TM TD057 (tank temps. range) went OOL HH with a value of 10.41 degC. Spacecraft Anomaly XMM_SC-60 raised • Tank1 Thermostat failed • OOL triggered because Tank1 temperature was more than 10 degC lower than Tanks 2, 3 and 4 • Conclusion from Industry (Astrium) was that this excursion had no impact on Reaction Control System • No possibility of pressurant gas entering pipes downstream of Tank1 unless Tank1 nearing empty (< ~6Kg) • Total fuel then ~80Kg (or 20Kg per tank) • Lower temp encourages more fuel into Tank 1 • Recommendation • Maintain Tank1 temperature control using time-tagged commands keeping temperature range between tanks <5degC • Try to gauge fuel distribution between tanks to better determine when a tank is near empty
XMM Reaction Control System • 4 Tanks • Hydrazine Fuel • Helium Pressurant • T1 Main Tank • T2,T3,T4 Aux • Latch Valves • LV-1 feeds Branch A • LV-2 feeds Branch B • Pressure Transducers • PT-1 System Pressure • PT-2 Branch A Press. • PT-3 Branch B Press. • Reaction Control Thrusters • 4x Branch A • 4x Branch B PT-2 PT-3 LV-1 LV-2 PT-1 T1 T2 T3 T4
Book-keeping: Principles . m • Specific Impulse (Isp) of thrusters known Isp ~ 2250Ns/kg but varies with inlet pressure • Thrust known • Nominally 25N (at 25bar) • Now <10N (<7bar) • Can measure with flight calibration • Fuel mass flow through thrusters can be derived . Thrust = Isp * m . One firing: ∆m = m. ∆ton = Thrust. ∆ton / Isp • Keep running count of thruster activations (On-times) mfuel = mloaded - ∑∆m LV-1 PT-1 mfuel
Book-keeping: Errors • BOL =5 % (<11Kg), EOL =20% (18Kg) [RD-2] • Actually EOL is when Inlet Pressure = 8 bar. PT-01 < 7bar So we are already past EOL!! • No calibration for Thrust and Isp below this pressure. Also calibration data is based on constant thrust. Momentum dumping is via short pulse firings. • PT-01 reading need to be corrected for Temperature variations and also converted to correct inlet pressure to use these calibrations.
PVT: Principles . m PHeVHe = nHeRTHe where PHe ~ PT-01 nHe number of moles of He is constant. Assume 165moles loaded (~660g) R gas constant THe = average temp of He from tank thermistors VHe= Vtank – mfuel/ρfuel mfuel = ρfuel*(Vtank- nHeRTHe/PHe) LV-1 PT-1 mfuel PHe VHe THe
PVT: Spot Checks • PVT figures (first est. from FCT) follow the book-keeping (Flight Dynamics figures) • No evidence of leakage • Error bars for Book-keeping set at +/- 18Kg • PVT errors estimated to be 12Kg [RD-2]
Thermal Gauging: Principle • The thermal response of the propellant tank when heated is related to the propellant load. • Apply the Energy equation Q.∆t = m.Cp.∆T • Where: Q is applied heat rate minus heat loss to the environment (J/s) ∆t is the change in time (s) m is the mass of the tank system (kg) Cp is the specific heat of the tank system (J/kg.K) ∆T is the change in temperature (K) • Ie. A full tank should have greater heat capacity, therefore requires longer heating time to reach a given ∆T than an empty tank.
Tank Duty Cycle Over lifetime • Temperature gradient increases • Temperture cycle time (peak-to-peak) reduces • Heater Off-time (or On-time) reduces
Fuel ratios for each tank • For any tank m.Cp = [m.Cp]tank + mfuel.Cpfuel + mHe.CpHe If [m.Cp]tank andmHe.CpHe neglected If Q considered constant (ca. 14W steady heat input) Then [mfuel]rev-1 / [mfuel]rev-n = [∆t/∆T]rev-1/ [∆t/∆T]rev-n Or if ∆T is constant (thermostat set-points fixed) [mfuel]rev-1 / [mfuel]rev-n = [∆t]rev-1/ [∆t]rev-n
Try Tank 1[∆t/∆T]rev-100/ [∆t/∆T]rev-1000 • prove of concept: data from rev 100 compared to rev 1000 • In reality due to the quantization of HK data the method is highly dependent on the data selection for the determination of the slope
Fuel Ratios: Cycle Time Measurement • Method 1 • Spot checks of Tank cycles over 10 days at 1 year intervals
Fuel Ratios: Cycle Time Measurement • Method 2 • Statistical analysis of all temperature data over 230 days in 2000 and in 2008 • Example of Cycle times • Green -with angle correction • Red - without angle correction
Compare to Book-keeping • Methods agree within error margins • Tank 2 supplying more Fuel? • But 30Kg fuel missing? * Data taken from 2009 for Tank 3
Thermal Gauging: Method 3 • In the simplest form a single tank system can be described as • a Capacitance (m.Cp) • with a Conductive coupling to the environment (the XMM base plate). • In the steady state condition with heater off the system will be at Tmin. • When heat is applied at a constant rate Qin the tank temperature will increase. • The higher the temperature with respect to Tmin the higher the heat losses Qout until eventually the tank system reaches equilibrium again at Tmax with Qin = Qout.
Method 3: System Response When heating from Tmin to Tmax: T = Tmin + ∆T (1 - exp(-t/tau1)) ∆ T = Tmax – Tmin tau1 = Time constant for heating When cooling the function is: T = Tmax - ∆T (1 - exp(-t/tau2)) ∆ T = Tmax – Tmin tau2 = Time constant for cooling
Method 3: Analysis • For the heating case: Differentiating => d/dt(T) = ∆T/tau1 (exp(-t/tau1)) • In the initial condition when temperature T=Tmin and time t=0 the gradient is therefore simply: Initial gradient = ∆T/tau1 • This initial gradient is shown as the blue line (previous slide) • If it is assumed that at this instant the heat loss is zero (Qout = 0) and all heater power is therefore applied to the tank (Qin = heater power), then if we apply the energy equation (see Thermal Gauging Principle slide) we have: Qin / m.Cp = ∆T / tau1
Method 3: Analysis • We now have to assume the mass and heat capacity of the Helium gas in the tank can be neglected. If so then we can write: m.Cp = [m.Cp]tank + mfuel.Cpfuel = Qin.(tau1/∆T) • or rearranging: mfuel = ( Qin.(tau1/∆T) - [m.Cp]tank ) / Cpfuel • Simply by estimating tau1 and ∆T (Graphical best fit), it was possible to arrive at absolute values for the fuel in each tank. • In practice it was difficult to find times where data was stable enough to make a fit: Best data from periods of Solar Flares where S/C in same pointing for number of days
Method 3: Results • Surprising Results Tank 2 (as before) appears to have least fuel Tank 4 has 2 to 3 times more fuel than Tank 1 Tank 1 (most important) looks OK
Thermal Gauging vs Book-keeping • Still 30 Kg missing…
Astrium review • In February 2010 FCT sent Fuel Mass Calculation document [RD-03] to Industry (Astrium) for review • March 2010 Detailed Analysis received [RD-04] • No need for alarm, the assymetry in fuel mass could not occur • Errors in initial loaded could account for ~2Kg difference between tanks • Fuel / pressurant gas migration between tanks during initial fuel orientation manoeuvres (LEOP) could also account for ~2Kg difference • Since LEOP the only way to account for more significantly fuel in Tank4 is a leakage of pressurant gas (loss of 3bar!! Would be observable – but is not) • This is ruled out since a leakage is not observable in PVT analysis nor in analysis of disturbance torques (Flight Dynamics) • Two explanations for the assymetry calculated • Tank 4 is better insulated (this tank is on the cold side) • Temperature measurments are taken from thermistors placed near middle of Tanks (in contact with He) rather than the top (in contact with Fuel)
Way Ahead • Book-keeping – seeking better ground calibration data for thruster performance - Which temperatures to use for correcting pressure variations • Tank gauging (Thermal knocking) requires a better tank model (thermal properties, location of fuel, location of thermistors) and then calibration against flight telemetry Comparison of Relative Accuracies [RD-7]
Way Ahead – Thermal Knocking • Flight Calibration? • Perhaps TANK 4 is best suited
References RD-1 Assessment of XMM Anomaly XMM_SC-60 and Recovery Action, Astrium, 21/07/2009 RD-2 RCS SSD - Annex B: Fuel Book-keeping Accuracy for XMM, XMM-MOC-SSD-0019-OAD, March 2002 RD-3 XMM-Newton Fuel Mass Calculation, J.Martin, Draft, 01-02-2010 RD-4 Assymetric Tank Depletion, Astrium, 11-03-2010 RD-5 XMM-Newton RCS Fluid Dynamics Analysis, XM-TN-BPD-0013 RD-6 XMM-Newton RCS Flight Model Users Manual, XM-TN-BPD-0005 RD-7 Comparative Assessment of Gauging Systems and Description of a Liquid Level Gauging Concept for a Spin Stabilized Spacecraft, Hufenbach.B. 1997ESASP.398..561H RD-8 Flight Validation of the Thermal Propellant Gauging Method Used at EADS Astrium, L. Dandaleix, 2004ESASP.555E...9D