Download
1 / 43
430 likes | 573 Views
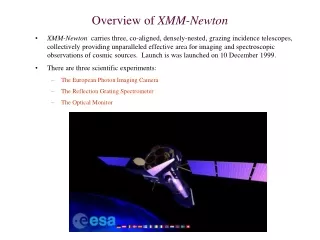
The XMM Large Scale Structure (XMM-LSS) Survey. Andy Read University of Leicester (for the XMM-LSS Consortium). Marseille (LAM) Milano (AOB) Milano (IFCTR) Munich (MPA) Paris (IAP) Santiago (Uni. Cato.). A Europe /Chile Consortium. PI : Saclay, France. Birmingham Bristol

E N D
The XMM Large Scale Structure (XMM-LSS) Survey Andy Read UniversityofLeicester (for the XMM-LSS Consortium)
Marseille (LAM) Milano (AOB) Milano (IFCTR) Munich (MPA) Paris (IAP) Santiago (Uni. Cato.) A Europe/Chile Consortium PI : Saclay, France • Birmingham • Bristol • Copenhagen • Dublin • ESO/ Santiago • Leiden • Liège
XMM sensitivity Effective Area 12.5Å 1.25Å
The XMM-LSS Survey • XMM’s unrivalled sensitivity, large FOV (d~25’) and good PSF opens a new area for the study of the cluster Large Scale Structure (LSS) • Goal: determine the cluster correlation function in two redshift bins 0 < z < 0.5, 0.5 < z < 1,each bin containing 450 clusters • Fixes the XMM-LSS survey characteristics: 8x8 sq.deg. area covered by 10 ksec XMM pointings • - Sensitivity: 5e-15 ergs/s/cm² in [0.5-2 keV] band • Able to Map the evolution of the LSS of the universe out to z~1, with both the galaxy cluster and the QSO populations for the first time
Expected number of clusters in an 8x8 sq. deg. area ~ 900 clusters 0 < z < 1 for CDM ~ 300 clusters z > 1
Expected numbers of objects At the survey sensitivity: ~ 5e-15 erg/s/cm² (0.5-2 keV) ~ 250 X-ray sources per square degree: • 200 QSO/AGN ( 40% z < 1) • 15 clusters z<1 • 5 clusters 1< z <2 ? • Galaxies + stars
The XMM-LSS … so far • - Aim: 64 sq.deg. • 10 ksec exposures • Already observed: • 46 XMM pointings • ~5 sq.deg. (May 03)
Multi-wavelength follow-up • CFHT/CFH12K (VVDS Deep): 2 sq.deg. GT(WL) • CFHT/CFH12K (VVDS Wide): 3 sq.deg. GO(WL) • CFHT/Megacam: 72 sq.deg. (WL) • CTIO 4m/MOSAIC: ~16 sq.deg. • UKIRT/WFCAM: 8.75 sq.deg. • VLA A array: 110 sq.deg. @ 74 MHz • VLA A array: 5.6 sq.deg. @325 MHz • OCRA: all XMM clusters @ 30 GHz • AMIBA: 70 sq.deg. @ 95 GHz • SIRTF/IRAC: 8.7 sq.deg. (SWIRE Legacy) • SIRTF/MIPS: 8.9 sq.deg. (SWIRE Legacy) • GALEX: ~ 20 sq.deg.
Survey Location XMM-LSS XMDS & VIRMOS VVDS deep VIRMOS VVDS wide XMM Subaru Deep Survey SIRTF Legacy : SWIRE NOAO Deep Survey Galex HI map NH~1.4-3.5 e20
The First Data: 15 GO Pointings • 15 Pointings (MOS1, MOS2 & pn, all with ~10 ksec) • Standard XMM-SAS (emchain and epchain) processing • Flare-cleaned to common level of low background • Bad pixel analysis and removal • RGB mosaic constructed (0.3-1, 1-2.5, 2.5-10 keV) • Rigorous background subtraction, to account for extended sources, involving background event files (Read & Ponman 2003) and closed datasets (Marty et al. 2002)
Imaging: Background subtraction Source data Closed data Background data Source (vignetted) + Background: - Photons (vignetted) Particles (non-vignetted) Background: - Particles (non-vignetted) Background: - Photons (vignetted) Particles (non-vignetted) Only BG particles appear in out-of-field-of-view (out-of-FOV) areas [i.e. corners]
Imaging: Double-background subtraction Source Closed data (Particles) Background data (photons+particles) - Evaluate all out-of-FOV events – calculate scalings CreateimageCreate scaled P imageCreate scaled BG image • Subtract to give • Source image (no particles) • Subtract to give • scaledBG image (no particles) * Start `soft excess’ loop over several small energy bands Create large-R annular imageCreate large-R annular P imageCreate large-R annular BG image (source-free) Scale to sourceScale to source • Subtract to give • Source annulus (no particles) • Subtract to give • BG annulus (no particles) • Subtract to calculate ‘soft excess’ at large-R for particular energy - Create exposure map in small energy band – use to create full field `soft excess’ image *End Loop over energies to accumulate total energy, full field `soft excess’ image -Add `soft excess’ to Scaled BG image to create double background -Add double background to scaled particles image to create total background
Part of the XMM-LSS mosaic : 15 pointings (~1.6 sq.deg.) Andy Read Circles: ROSAT All-Sky Survey Red[0.3-1]keV Green[1-2.5]keVBlue[2.5-10]keV
‘Big C’ – XMMUJ022540-031111 Hardness map of centre • Hotter at interface • (kT~7.6keV) All-EPIC, BG-sub, exp-corr. contours on CFHT I band image z~0.29, kT~6.2 keV, Lx~3e44 erg/s
Detection Algorithm Overview Sergio Dos Santos, Saclay • Standard SAS processing • - emchain & epchain + flare removal • Wavelet filtering of images (M1-M2-PN) • - in counts (preserving Poisson stats) • - computing threshold by histogram auto-convolution • Exposure correction on a per instrument basis • Addition of exposure-corrected images • 1st detection step: Sextractor (XMM-PPS uses eboxdetect) • on co-added images • - with low detection threshold, to avoid missing faint sources • - with parameters adjusted for X-ray filtered images • - Max. Likelihood fit step: EMLdetect (with extension fit & CAL psf) • - source input list from Sextractor • - X/Y & extent tied for 3 instruments, normalization free • - ML min = 8.5 • Final X-ray catalogue: • - Mix of Sextractor/EMLdetect results
Detection Algorithm Validation XMM Simulations On instrument by instrument basis: - Instrumental effects included: PSF (analytic), vignetting (energy dependent), CCD gaps, bad pixels - Background (Read & Ponman 2003): Cosmic (vignetted) & Particles (non-vignetted) - Source modelling (in at least two bands): - Point sources (random positioning in FOV): Flux distribution: LogN-LogS (Moretti et al. 2003) - Extended sources: King model surface brightness - β = 2/3 - Rcore = Rvirial/10 (Rvirial from temperature) Flux from local Lx-T (Arnaud & Evrard 1999)
Simulated XMM Images Single pointing (10ks) Photon image [0.4-4 keV] Wavelet-filtered + Poisson photon statistics model (Starck & Pierre 1998) [pre-Sextractor detection]
Detection Algorithm ValidationResults • Results encouraging: • - Most, if not all clusters (T>4keV) up to z~1 can be detected • using 10 ksec XMM pointings • - Richest clusters should be detected at z<2 (if they exist!) • - Very small rate of spurious detections (<1 per pointing), due • to 2-stage process
XMM-LSS: Selected Results • ~60 Candidate extended sources over ~ 3.5 sq.deg. • i.e. as expected ~15+ extended sources per sq.deg. • 10 ksec XMM + 2h VLT allow T (±1 keV) • measurement and velocity dispersion at z~0.8 • Intermediate mass systems are being uncovered by XMM • First results described in four papers • Pierre et al, 2003, astro-ph/0305191 • Valtchanov et al, 2003, astro-ph/0305192 • Willis et al, 2003, in prep • Andreon et al, in prep
Identification procedure XMM EPIC image + contours CFHT 3-colour VRI image + EPIC contours
CFHT I-band image EPIC contours Photometricredshift
Predicted z (photometric) from VBRI images: Sources ~1’ from centre All sources Measured z: 0.61 !
CFH12k I-band EPIC contours Nearby group
Image: z´-band CTIO EPIC contours Cluster without X-ray counterpart (z~0.3-0.4)
Z > 1 Candidate CFH12k VRI images VIRMOS DS ~ 560 cts [0.5-5] keV XMM-EPIC X-ray contours from wavelet filtering
NIR identification of z~1 XMM-LSS clusters XMM (PN) image (+X-ray detection ellipse) SOFI (NTT) K-band image (galaxies hardly seen on deep I (CFHT) and z’ (CTIO) images)
NIR confirmed clusters Extended X-ray sources showing spatially coincident, statistically significant galaxy overdensity EPIC contours on K-band images ~1’x1’
EPIC contours on CFHT images – cluster candidates at z~0.4 006 012
2-D fitting of X-ray emission • Simultaneous fitting of MOS1, MOS2 and pn images • - Images and exposure maps required • PSF images required (created via XMM-SAS-calview) • Masks can be used to ignore e.g. nearby point sources • Source (src) and background (BG) boxes are chosen • 2-D fitting: β-model (using CIAO-sherpa) • 3 separate models (with tied parameters) for M1, M2, pn • Constant BG level(s) fit to BG emission • src+BG model fit to source emission (src = β-model) • Core radius Ro, slope β, ellipticity ε, pos.angle θtied • between 3 instruments, normalization free _________ A f(x,y) = f(r) = [r=f(x,y,ε,θ)] 3β-½ (1+[r/r0])
2-D model contours overlayed on XMM-EPIC X-ray emission Ro=24.0"β=0.63 Ro=24.2"β=0.40 Ro=59.8"β=0.72 Ro=8.7"β=0.44 Ro=12.9"β=0.73 Ro=37.4"β=0.51 Ro=11.8"β=0.67 Ro=4.7"β=0.40 Ro=6.5"β=0.40 Ro=2.5"β=0.42 Ro=12.1"β=0.55 Ro=5.3"β=0.41
XMM-LSS First accepted papers: astro-ph/0305191 astro-ph/0305192 http://vela.astro.ulg.ac.be/themes/spatial/xmm/LSS/index_e.html
Data release • 2003: clusters published (coordinates, z) astro-ph/0305191 astro-ph/0305192 • 2004:publication of the X-ray catalogue from the XMM A01 data • Database increased/updated annually: X-ray, optical, VLA, then SIRTF