Download
1 / 1
10 likes | 139 Views
Quantifying the carbon benefits of forest protection projects through modeling deforestation in East Kalimantan, Indonesia. This work was supported under a cooperative agreement from United States Agency for International Development (USAID), Cooperative Agreement No. EEM-A-00-03-00006-00.

E N D
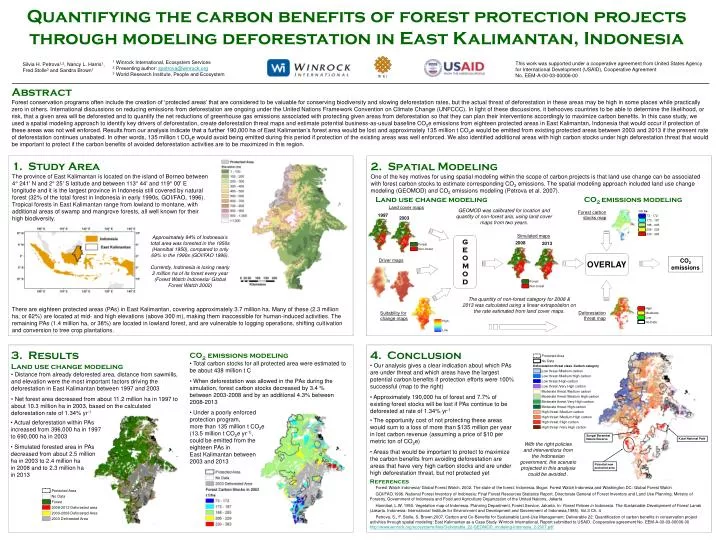
Quantifying the carbon benefits of forest protection projects through modeling deforestation in East Kalimantan, Indonesia This work was supported under a cooperative agreement from United States Agency for International Development (USAID), Cooperative Agreement No. EEM-A-00-03-00006-00 1 Winrock International, Ecosystem Services 2 Presenting author: spetrova@winrock.org 3 World Research Institute, People and Ecosystem Silvia H. Petrova1,2, Nancy L. Harris1, Fred Stolle3 and Sandra Brown1 Abstract Forest conservation programs often include the creation of ‘protected areas’ that are considered to be valuable for conserving biodiversity and slowing deforestation rates, but the actual threat of deforestation in these areas may be high in some places while practically zero in others. International discussions on reducing emissions from deforestation are ongoing under the United Nations Framework Convention on Climate Change (UNFCCC). In light of these discussions, it behooves countries to be able to determine the likelihood, or risk, that a given area will be deforested and to quantify the net reductions of greenhouse gas emissions associated with protecting given areas from deforestation so that they can plan their interventions accordingly to maximize carbon benefits. In this case study, we used a spatial modeling approach to identify key drivers of deforestation, create deforestation threat maps and estimate potential business-as-usual baseline CO2e emissions from eighteen protected areas in East Kalimantan, Indonesia that would occur if protection of these areas was not well enforced. Results from our analysis indicate that a further 190,000 ha of East Kalimantan’s forest area would be lost and approximately 135 million t CO2e would be emitted from existing protected areas between 2003 and 2013 if the present rate of deforestation continues unabated. In other words, 135 million t CO2e would avoid being emitted during this period if protection of the existing areas was well enforced. We also identified additional areas with high carbon stocks under high deforestation threat that would be important to protect if the carbon benefits of avoided deforestation activities are to be maximized in this region. 1. Study Area The province of East Kalimantan is located on the island of Borneo between 4° 241' N and 2° 25' S latitude and between 113° 44' and 119° 00' E longitude and it is the largest province in Indonesia still covered by natural forest (32% of the total forest in Indonesia in early 1990s, GOI/FAO, 1996). Tropical forests in East Kalimantan range from lowland to montane, with additional areas of swamp and mangrove forests, all well known for their high biodiversity. 2. Spatial Modeling One of the key motives for using spatial modeling within the scope of carbon projects is that land use change can be associated with forest carbon stocks to estimate corresponding CO2 emissions. The spatial modeling approach included land use change modeling (GEOMOD) and CO2 emissions modeling (Petrova et al. 2007). CO2 emissions modeling Land use change modeling Land cover maps GEOMOD was calibrated for location and quantity of non-forest aria, using land cover maps from two years. Forest carbon stocks map 1997 2003 Simulated maps Approximately 84% of Indonesia’s total area was forested in the 1950s (Hannibal 1950), compared to only 69% in the 1990s (GOI/FAO 1996). Currently, Indonesia is losing nearly 2 million ha of its forest every year (Forest Watch Indonesia/ Global Forest Watch 2002) G E O M O D 2008 2013 OVERLAY CO2 emissions Driver maps The quantity of non-forest category for 2008 & 2013 was calculated using a linear extrapolation on the rate estimated from land cover maps. There are eighteen protected areas (PAs) in East Kalimantan, covering approximately 3.7 million ha. Many of these (2.3 million ha, or 62%) are located at mid- and high elevations (above 300 m), making them inaccessible for human-induced activities. The remaining PAs (1.4 million ha, or 38%) are located in lowland forest, and are vulnerable to logging operations, shifting cultivation and conversion to tree crop plantations. Deforestation threat map Suitability for change maps • 4. Conclusion • Our analysis gives a clear indication about which PAs are under threat and which areas have the largest potential carbon benefits if protection efforts were 100% successful (map to the right) • Approximately 190,000 ha of forest and 7.7% of existing forest stocks will be lost if PAs continue to be deforested at rate of 1.34% yr-1 • The opportunity cost of not protecting these areas would sum to a loss of more than $135 million per year in lost carbon revenue (assuming a price of $10 per metric ton of CO2e) • Areas that would be important to protect to maximize • the carbon benefits from avoiding deforestation are areas that have very high carbon stocks and are under high deforestation threat, but not protected yet • 3. Results • Land use change modeling • Distance from already deforested area, distance from sawmills, and elevation were the most important factors driving the deforestation in East Kalimantan between 1997 and 2003 • Net forest area decreased from about 11.2 million ha in 1997 to about 10.3 million ha in 2003, based on the calculated deforestation rate of 1.34% yr-1 • CO2 emissions modeling • Total carbon stocks for all protected area were estimated to be about 438 million t C • When deforestation was allowed in the PAs during the simulation, forest carbon stocks decreased by 3.4 % between 2003-2008 and by an additional 4.3% between 2008-2013 • Under a poorly enforced • protection program, • more than 135 million t CO2e • (13.5 million t CO2e yr-1), • could be emitted from the • eighteen PAs in • East Kalimantan between • 2003 and 2013 • Actual deforestation within PAs • increased from 396,000 ha in 1997 • to 690,000 ha in 2003 • Simulated forested area in PAs decreased from about 2.5 million ha in 2003 to 2.4 million ha • in 2008 and to 2.3 million ha • in 2013 Sungai Barambai Nature Reserve Kutai National Park With the right policies and interventions from the Indonesian government, the scenario projected in this analysis could be avoided . Potential new protected area References Forest Watch Indonesia/ Global Forest Watch. 2002. The state of the forest: Indonesia. Bogor. Forest Watch Indonesia and Washington DC: Global Forest Watch GOI/FAO.1996. National Forest Inventory of Indonesia: Final Forest Resources Statistics Report. Directorate General of Forest Inventory and Land Use Planning, Ministry of Forestry, Government of Indonesia and Food and Agriculture Organization of the United Nations, Jakarta Hannibal, L.W. 1950. Vegetation map of Indonesia. Planning Department, Forest Service, Jakarta. In: Forest Polices in Indonesia. The Sustainable Development of Forest Lands (Jakarta, Indonesia: International Institute for Environment and Development and Government of Indonesia,1985). Vol.3 Ch. 4 Petrova, S., F. Stolle, S. Brown.2007. Carbon and Co-Benefits for Sustainable Land-Use Management: Deliverable 22: Quantification of carbon benefits in conservation project activities through spatial modeling: East Kalimantan as a Case Study. Winrock International, Report submitted to USAID. Cooperative agreement No. EEM-A-00-03-00006-00 http://www.winrock.org/ecosystems/files/Deliverable_22-GEOMOD_modeling-Indonesia_2-2007.pdf