Asymptotics for the Spatial Extremogram
Richard A. Davis* Columbia University. Asymptotics for the Spatial Extremogram. Collaborators : Yongbum Cho, Columbia University Souvik Ghosh, LinkedIn Claudia Klüppelberg , Technical University of Munich Christina Steinkohl, Technical University of Munich. Plan. Warm-up

Asymptotics for the Spatial Extremogram
E N D
Presentation Transcript
Richard A. Davis* Columbia University Asymptotics for the Spatial Extremogram Collaborators: Yongbum Cho, Columbia University Souvik Ghosh, LinkedIn Claudia Klüppelberg, Technical University of Munich Christina Steinkohl, Technical University of Munich
Plan • Warm-up • Desiderata for spatial extreme models • The Brown-Resnick Model • Limits of Local Gaussian processes • Extremogram • Estimation—pairwise likelihood • Simulation examples • Estimating the extremogram • Asymptotics in random location case • Composite likelihood • Simulation examples • Two examples
Extremogram in Space Setup: Let be a stationary (isotropic?) spatial process defined on (or on a regular lattice ).
Illustration with French Precipitation Data Data from Naveau et al. (2009). Precipitation in Bourgogne of France; 51 year maxima of daily precipitation. Data has been adjusted for seasonality and orographic effects.
Warm-up Desiderata for Spatial Models in Extremes: {Z(s), s D} Model is specified on a continuous domain D (not on a lattice). Process is max-stable: assumption may be physically meaningful, but is it necessary? (i.e., max daily rainfall at various sites.) Model parameters are interpretable: desirable for any model! Estimation procedures are available: don’t have to be most efficient. Finite dimensional distributions (beyond second order) are computable: this allows for computation of various measures of extremaldependence as well as predictive distributions at unobserved locations. Model is flexibleand capable of modeling a wide range of extremal dependencies.
Building a Max-Stable Model in Space • Building blocks: Let be a stationary Gaussian process on with mean 0 and variance 1. • Transform the processes viawhereFis the standard normal cdf. Then has unit Frechetmarginals, i.e., • Note: For any (nondegenerate) Gaussian process we have • and hence • In other words, • observations at distinct locations are asymptotically independent. • not good news for modeling spatial extremes!
Building a Max-Stable Model in Space-Time Now assume is isotropic with covariance function where > 0is the range parameter and (0,2]isthe shape parameter. Note that and hence where . It follows that
Then, • onHere the are IID replicates of the GP andis a Brown-Resnick max-stable process. • Representation for : • where • of a Poisson process with intensity measure • (are iid Gaussian processes with mean zero and variogram Building a Max-Stable Model in Space-Time
Then, • on • Bivariate distribution function: • where • and Note • V(x,y;) → x-1 + y-1 as →∞ (asymptotic indep) • V(x,y;) →1/min(x,y) as → 0 (asymptotic dep) Building a Max-Stable Model in Space-Time
Scaled and transformed Gaussian random fields (fixed time point)
Scaled and transformed Gaussian random fields (fixed time point)
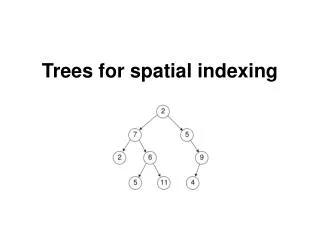
Lattice vscont space Setup: Let be a RV stationary (isotropic?) spatial process defined on (or on a regular lattice ). Consider the former—latter is more straightforward. regular grid random pattern
France Precipitation Data regular or random? Regular or random
Regular grid regular grid h = 1; # of pairs = 4 h = sqrt(10); # of pairs = 8 h = sqrt(18); # of pairs = 4 h = sqrt(2); # of pairs = 4 h = 2; # of pairs = 4
Random pattern random pattern h = 1; # of pairs = 0 h = 1 .25
Random pattern Zoom-in buffer Estimate of extremogram at lag h = 1 for red point: weight “indicators of points” in the buffer. Bandwidth: half the width of the buffer.
Random pattern random pattern • Note: • Expanding domain asymptotics: domain is getting bigger. • Not infill asymptotics: insert more points in fixed domain.
Estimating the extremogram--random pattern Setup: Suppose we have observations, at locations of some Poisson process with rate in a domain . Here, number of Poisson points in Weight function : Let be a bounded pdf and set where the bandwidth
Estimating extremogram--random pattern Kernel estimate of : Note: )is product measure off the diagonal.
Limit Theory Theorem: Under suitable conditions on (i.e., regularly varying, mixing, local uniform negligibility, etc.), then where is the pre-asymptotic extremogram, ( is the quantile of ). Remark: The formulation of this estimate and its proof follow the ideas of Karr (1986) and Li, Genton, and Sherman (2008).
Limit theory Asymptotic “unbiasedness”: is a ratio of two terms; will show that both are asymptotically unbiased. Denominator: By RV, stationarity, and independence of and
Limit Theory Numerator: = = where Making the change of variables and the expected value is =|
Limit Theory • Remark: We used the following in this proof. • and . • Need a condition for the latter.
Limit theory Local uniform negligibility condition (LUNC): For any , there exists a such that Proposition: If is a strictly stationary regularly varying random field satisfying LUNC, then for This result generalizes to space points, .
Limit Theory • Outline of argument: • Under LUNCalready shown asymptotic unbiasedness of numerator and denominator. • with . • Strategy: Show joint asymptotic normality of and
Limit Theory Step 1: Compute asymptotic variances and covariances. Proof of (i):Sum of variances + sum of covariances
Limit Theory Step 2: Show joint CLT for and using a blocking argument. Idea: Focus on Set and put We will show is asymptotically normal.
Limit Theory Subdivide into big blocks and small blocks. where and size
Limit Theory Insert block inside with dimension : Subdivide into big blocks and small blocks. where and size
Limit Theory Recall that is a (mean-corrected) double integral over
Limit Theory Remaining steps: Show Let be an iid sequence with whose sum has characteristic function Show Intuition. The sets are small by proper choice of Use a Lynapounov CLT (have a triangular array). Use a Bernstein argument (see next page).
Limit Theory Useful identity: (by indep of ) whereis a strong mixing bounding function that is based on the separationhbetween two sets UandVwith cardinality rands.
Strong mixing coefficients Strong mixing coefficients: Let be a stationary random field on Then the mixing coefficients are defined by where the sup is taking over all sets with and Proposition (Li, Genton, Sherman (2008), Ibragimov and Linnik (1971)): Let and be closed and connected sets such that and and are rvs measurable wrtand respectively, and bded by 1, then .
Limit Theory Mixing condition:for some Returning to calculations:
Simulations of spatial extremogram Extremogram for one realization of B-R process (function of level) Note:black dots = true; blue bands are permutation bounds Lattice Non-Lattice
Simulations of spatial extremogram Max-moving average (MMA) process: Let be an iid sequence of Frechetrvs and set where MMA(1): Extremogram:
Simulations of spatial extremogram Box-plots based on 1000 (100) replications of MMA(1) (left) and BR (right) Lattice Non-lattice; (left) (right)
Space-Time Extremogram Extremogram. For the special case, , For the Brown-Resnick process described earlierwe find that )and )
Inference for Brown-Resnick Process Semi-parametric: Use nonparametric estimates of the extremogram and then regress function of extremogram on the lag. Regress: , The intercepts and slopes become the respective estimates of and Asymptotic properties of spatial extremogram derived by Cho et al. (2013). Pairwise likelihood: Maximize the pairwise likelihood given by
Inference for Brown-Resnick Process Semi-parametric: Use nonparametric estimates of the extremogram and then regress function of extremogram on the lag. Regress:) ) , The intercepts and slopes become the respective estimates of and Asymptotic properties of spatial extremogram derived by Cho et al. (2013). Pairwise likelihood: Maximize the pairwise likelihood given by
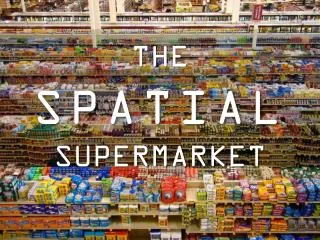
Data Example: extreme rainfall in Florida Radar data: Rainfall in inches measured in 15-minutes intervals at points of a spatial 2x2km grid. Region: 120x120km, results in 60x60=3600 measurement points in space. Take only wet season (June-September). Block maxima in space: Subdivide in 10x10km squares, take maxima of rainfall over 25 locations in each square. This results in 12x12=144 spatial maxima. Temporal domain: Analyze daily maxima and hourly accumulated rainfall observations. Fit our extremal space-time model to daily/hourly maxima.
Data Example: extreme rainfall in Florida Hourly accumulated rainfall time series in the wet season 2002 at 2 locations.
Data Example: extreme rainfall in Florida Hourly accumulated rainfall fields for four time points.
Data Example: extreme rainfall in Florida Empirical extremogram in space (left) and time (right)
Data Example: extreme rainfall in Florida Empirical extremogram in space (left) and time (right): spatial indep for lags > 4; temporal indep for lags > 6.
Data Example: extreme rainfall in Florida Empirical extremogram in space (left) and time (right)
Data Example: extreme rainfall in Florida Computing conditional return maps. Estimate such that wheresatisfiesis pre-assigned. A straightforward calculation shows that must solve,
100-hour return maps (): time lags = 0,2,4,6 hours (left to right on top and then right to left on bottom), quantiles in inches.