Download
1 / 19
190 likes | 462 Views
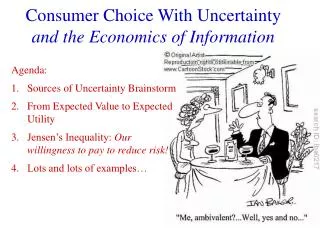
Consumer Choice With Uncertainty and the Economics of Information. Agenda: Sources of Uncertainty Brainstorm From Expected Value to Expected Utility Jensen’s Inequality: Our willingness to pay to reduce risk! Lots and lots of examples….

E N D
Consumer Choice With Uncertainty and the Economics of Information • Agenda: • Sources of Uncertainty Brainstorm • From Expected Value to Expected Utility • Jensen’s Inequality: Our willingness to pay to reduce risk! • Lots and lots of examples…
“The revolutionary idea that defines the boundary between modern times and the past is the mastery of risk: the notion that the future is more than a whim of the gods and that men and women are not passive before nature…By showing the world how to understand risk, measure it, and weight its consequences, they converted risk-taking into one of the prime catalysts that drives modern Western Society.”
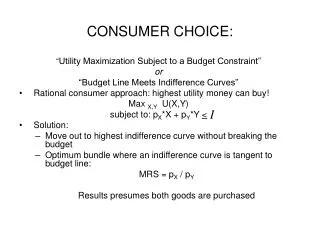
Expected Value to Expected Utility: Investment Example Revisited You make an initial investment of $10,000 A: The market goes up, gain $1,000 = 20% B: The market stays the same, gain $0 = 50% C: The market goes down, loose $5,000 = 30% What is the EXPECTED VALUE of your position? ($11,000 x .2) + ($10,000 x .5) + ($5,000 x .3) = $8,700 What is the EXPECTED UTILITY of your position? What units?
Key Tool: Decision Trees Nodes .2 .5 .3 =1 Branches $11,000 $10,000 $5,000 What is the EXPECTED VALUE of your position? ($11,000 x .2) + ($10,000 x .5) + ($5,000 x .3) = $8,700 What is the EXPECTED UTILITY of your position?
Von Neumann-Morgenstern Expected Utility Model Expected utility is the weighted average of the utilitiesof the different possible outcomes. Message: We make decisions based on utilities! General form for N different possible outcomes: Expected utility is the sum from 1 to N of the probability of the outcome times the utility of the outcome. The sum of all of the probabilities must equal 1 (collectively exhaustive). For two outcomes: Expected utility is probability of outcome M1 times the utility of the outcome M1 plus 1- the probability of outcome 1 times the utility of the outcome M2. The probability of outcome 1 must be less than or equal to 1.
Expected Value to Expected Utility: Investment Example Revisited You make an initial investment of $10,000 A: The market goes up, gain $1,000 = 20% B: The market stays the same, gain $0 = 50% C: The market goes down, loose $5,000 = 30% What is the EXPECTED VALUE of your position? ($11,000 x .2) + ($10,000 x .5) + ($5,000 x .3) = $8,700 What is the EXPECTED UTILITY of your position? What is the UTILITY of the EXPECTED VALUE?
Jensen’s Inequality For any concave function, the expected value of the function is less than the function of the expected value. Johan Ludwig William Valdemar Jensen “The key insight of the theory is that the expected values of the outcomes of a set of alternatives need not have the same ranking as the expected utilities of the alternatives.” Frank p. 181
You start with $40 and have a 50% chance of getting or losing $30 (Frank p. 182) What is your expected wealth? Should you take the gamble? No! Risk averse people don’t take fair gambles What is the UTILITY of your expected wealth? (read the answer off the graph) What is your expected utility? chord At what odds would you take the gamble? .7 - .5 = .2 = probability premium: the excess over fair odds to get you to gamble.
Because we are risk averse we are willing to pay MORE than the expected loss to reduce risk! → gains from trade!!
The Different Shapes of Risk Risk Averse Test yourself: Does Jensen’s Inequality hold for all types of risk preferences? Risk Neutral Risk Seeking
Key Formula Expected Utility WITH Risk = Expected Utility WITHOUT (with less) Risk What we are willing to pay! Example: (U = sqrt(M)) Your car is worth $3,000. You have a 10% chance of having it stolen without recovery. How much would you pay for insurance that would pay 100% of your car’s value if stolen? MathTrick Square both sides! Test yourself: What would you be willing to pay if you were risk neutral (U=M)?
“The Market for Lemons: Quality Uncertainty and the Market Mechanism” by George A. Akerlof (1970) QJE 84(3) 488 - 500 http://en.wikipedia.org/wiki/The_Market_for_Lemons If a good car is worth $10,000 and a “lemon” car is worth $2,000 how much would you be willing to pay for a car if you think 20% of cars are lemons and your utility = sqrt(M)? What units? Test Yourself: If you owned a “good” car would you be willing to sell it for the “market” price? If you know this (owners of good cars won’t sell) then how much would you be willing to pay?
Signaling! Test yourself: Can you come up with a question that determines how much a company would be willing to pay for “brand” identity? How about how much more a consumer would be willing to pay for a branded rather than generic item?
Insurance – Adverse Selection & “The Insurance Death Spiral” Assume there are two groups in the population: healthy people have a 10% chance of having $360 in expenses and sick people have a 50% chance of having $360 in expenses. If everyone starts with $1000 in wealth and U = sqrt(M), what is the most each group would be willing to pay for insurance? healthy .5 .5 sick .5 .9 .1 .5 Math Trick Multiply probabilities on each “branch” of the tree. $1,000 $640 $1,000 $640 $39.60 $190 .5*.1*$360 + .5*.5*360 = $108 If a risk-neutral insurer could not tell who is in which group, what premium would it have to charge to cover expected losses? What will happen to the market if they charge this?
Mark PaulyThe Economics of Moral Hazard: CommentThe American Economic Review 58(3):1968 Price of Medical Care D2’: mild illness D3’: serious illness D2’ and D3’: Inelastic demand no change in quantity at any price D2 D3’ D2 and D3: Elastic demand Lower price, higher quantity Marginal cost 1 Efficiency Loss Efficiency Loss 150 Quantity of Medical Care 50 200 300 AFP for D2’& D3’: ½ * 0 + ¼*$50 + ¼*$200 = $62.5 AFP for D2 & D3 : ½ *$ 0+ ¼*$150 + ¼*$300 = $112.5 People may be unwilling to pay 112.5. This is not market failure! Forcing people to have insurance does not improve social welfare.
The Price of Information You want to get into a top 10 MBA program because you will have an 80% chance of landing a job paying $100,000. In another program your chance of a $100,000 job is just 20%. You figure your odds of admission to a top program are 50-50. Is it worth paying an “admissions coach” $5,000 to improve your chance of admissions to 75%? Consider just one year of salary (not present value of future lifetime income) with a lower salary of $45,000 if you don’t get the $100,000 job. Yes! Utility with the coach = 270.34 > utility without = 264.18 If you’re the coach, could you charge more if you only get paid if your client gets into the top school and lands the $100K job? Assume no time value of money. Yes! You can charge $15,784 Test yourself: If you are the coach, what is your EXPECTED fee?
If you’re the coach, could you charge more if you only get paid if your client gets into the top school and lands the $100K job? Again, assume no time value of money. Top school .75 .25 Other School .8 .8 .2 .2
Management – Moral Hazard, Incentives and Transaction Costs You own a bar, and you face the risk that your bartender will serve free drinks to his friends. You estimate that the probability of this is 50-50, and if he does the lost value to you will be about $10,000 per year. In addition, if he serves an underage friend you can face a $1 million liability. You think the risk of this is only 15% and independent of whether he serves friends generally. You can install a video security system to reduce both probabilities (independently) to 5% for $50,000. You are a risk-neutral business owner. Should you install the system? Expected loss without the system: .5*.85*$10,000 + .5*.15*$1,010,000 = $80,000 Expected loss with the system: .05*.95*$10,000 + .05*.05*$1,010,000 = $3,000 Think about it: What other management considerations might you have? How would you feel as a bartender if you knew you were being watched all the time? How would you feel as a customer? What other things might you be able to do to reduce the risk?
Conclusion Uncertainty is everywhere! But we can deal with it!! Expected Value Expected Utility Willingness to Pay to reduce risk!