Download

1 / 43
430 likes | 613 Views
Marketing-Industry Analysis. MKT 731 Fall 2005 Instructor: Armand Gervais. Ryerson University Email: agervais@ryerson.ca preferred Web: www.ryerson.ca/~agervais Blackboard: https://my.ryerson.ca/webapps/login Office: Bus 308 Phone: 416-979-5000 Ext 4215. Lecture 1 Agenda.

E N D
Marketing-Industry Analysis MKT 731 Fall 2005 Instructor: Armand Gervais Ryerson University Email: agervais@ryerson.ca preferred Web: www.ryerson.ca/~agervais Blackboard: https://my.ryerson.ca/webapps/login Office: Bus 308 Phone: 416-979-5000 Ext 4215
Lecture 1 Agenda • Introductions • Overview of Course • Project Overview • Break • Competition and Business Strategy in Historical Perspective • Porters Framework • To Do’s for next weeks class • Questions and Answers • Begin forming Groups
Introduction Armand Gervais Education: • B. Comm. University of Toronto-Major Economics • MBA York University Business Experience: • 6 years retail management. Wendy's, Major Video • 4 years with Air Miles • Business/Database Analyst • Project Manager Database Development • ID-ONE Inc. Residential Interior Design • Partner and Operations Manager Industry Experience: • Retail-Confectionaries, clothing, travel, books and electronics. • Hospitality- restaurants and resorts • Telecommunications Industry • Loyalty programs Teaching Experience: • 3 years at Ryerson • MKT 731 (Industry Analysis), BUS 800 (Strategic Management)CMKT 200
Class –your turn • Your Name • School Major or specialization • Work or life experience • Expectations for the class • What are your objectives? • What has to happen for this to be a success for you?
Competition and Business Strategy in Historical Perspective Harvard Business School 9-798-010 Dec. 11, 1997 Pankaj Ghemawat & Peter Botticelli
Historical Background • Article focuses on the evolution of explaining sustained differences in performance of companies. • First Industrial revolution mid 1700’s-mid 1800s witnessed intense competition among industrial firms • Individual companies did not have the potential to affect competition or the competitive environment • Second Industrial revolution 1850+ • Development of railroads which created mass markets along with improved access to capital allowed for large scale production • Strategy emerged as a way to shape competitive environment • Adam’s Smith Invisible hand tamed by visible hand of managers • Strategy first articulated by Alfred Sloan • M-form of corporation-large investments in manufacturing and marketing and in management to coordinate these functions • General Motors 1923-46 Alfred Sloan devised strategy based on strengths and weaknesses
Historical Background • Challenges of WWII vital stimulus to strategic thinking • Learning curves became increasingly important tool for planning • Discovered by military aircraft industry 1920’s-1930’s • Direct labour costs decreased by a constant % as cumulative # of aircraft produced doubled. • Peter Drucker argued “management is not just passive,” “it means taking action to make the desired results come to pass” • Insight that a company can use business strategy to exert some positive control over market forces • It was not until the 1950’s and 1960’s that many large multinational corporations had to consider global competition.
Academic Underpinnings • Wharton 1881, Harvard 1908 • 1950’s Smith and Christensen taught students to question whether a firm’s strategy matched its competitive environment • How is the whole industry doing? How to compete with others? • What things does the firm have to be especially competent in order to compete? • By 1960’s SWOT was used in case studies • Although SWOT was used by many firms including Wal-Mart in the 90’s it did not define firm’s distinctive competence • Firms aspects that were enduring & unchanging vs. responsive • Theodore Levitt in article “Market Myopia” was critical of firms delivering the wrong product based on distinctive competence • He argued when companies fail it means the products offered failed to adapt to consumer needs. • Music industry and it current distribution model • Fax machine and advent of email
Igor Ansoff • Igor Ansoff argued that Levitt was asking companies to take unnecessary risks • Companies should ask if a product have a common thread with existing products • Sony photo optics cameras video cameras digital cameras • Customers are sometimes identified as the common thread • Issue is that customers will frequently have a range of unrelated product missions or needs Must leverage a companies core competencies. • McDonalds-Pizza, Wraps, salads etc. • Ansoff suggested the following categories for defining the common thread in its business/corporate strategy see next slide
Ansoff’s Product/Mission Matrix Present Product New Product Present Mission New Mission
Boston Consulting Group • 1960’s brought diversification and technological changes increasing the complexity of strategic situations companies faced • Henderson believed strategy should be based on logic not intuition • BCG wanted to explain why one competitor outperforms another assuming comparable management skills and resources. • BCG’s claim for the experience curve was for each cumulative doubling of experience, total costs decline by 20-30% due to economies of scale, organizational learning and technological innovation. • Therefore the producer producing the most, has the lowest costs and greatest profits • By the 1970’s the experience curve led to another “powerful oversimplification” the Growth Share Matrix • Using the firms experience curves areas of investment could by compared by plotting them on the grid
BCG’s Growth Share Matix High Share Low Share High Growth Slow Growth
BCG and McKinsey • BCG’s Strategy recommendation was to maintain a balance between “Cash cows” and “Stars” while allocating some resources to “Question Marks” • “Dogs” were to be sold off. • Since the producer with the largest stable market share eventually has the lowest costs and greatest profits it is vital to dominant market share • McKinsey argued that the firm should be organized on more strategic lines with greater concern for external conditions and more future oriented • 1971 GE asked McKinsey to examine their SBU’s • Not convinced that BCG’s Growth Matrix was sufficient McKinsey developed: Industry Attractiveness Business Strength Matrix • PIMS (Profit Impact of Market Strategies) used data from 620 SBUs from 57 diversified corporations. • Determined ROI by regressing historical returns on variables like market share, product quality, marketing, R&D and several others • Regression analysis established benchmarks for potential performance of SBU’s with particular characteristics against actual performance • By 1970’s virtually every consulting firm used some type of portfolio analysis to generate strategy recommendations • All these applications forced deaveraging of cost and performance numbers
Industry Attractiveness Business Strength Matrix Industry Attractiveness High Medium Low High Business Strength Medium Low
Theories under attack Experience Curve • High inflation and excess capacity due oil shocks of 1973 disrupted historical experience curves in many industries • Another problem pursuing a cost curve minimization strategy was that it reduced the firms ability to make innovative changes or respond to changes made by competitors • Ford’s focus on costs left him venerable to Sloan’s (GM’s) strategy of innovation. • Another issue is that experience curves assume experience can be kept proprietary. Managers and employees and suppliers are shared Portfolio Analysis under attack • Strategic recommendations were sensitive to specific portfolio analytic techniques employed. Depending on what technique was used you got a different answer! • Using these techniques resulted in nothing more than fine tuning current strategy • They ignored unexpected thrust from companies not considered competitors • Displacing technologies Airplanes vs. transoceanic liners • Largest criticism came from Hayes and Abernathy analysis promoted analytic detachment rather than insight and short term cost reduction rather than long term development of technological competitiveness. • These and other criticisms gradually diminished the popularity of portfolio analysis
Unbundling Industry Attractiveness • This all led to a new focus on Industry attractiveness and competitive position • U.S. industry competitive forces increase dramatically due to import competition, antitrust actions and deregulation • In 1958 56% of U.S. economy subject to competition by 1980 77% • Harvard School argued that the structure of many industries may permit incumbent firms to earn positive economic profits over long periods of time • Economists believed perfect competition that is large equally able competitors drive industry’s aggregate economic profits down to zero • Joe Bain of Harvard Economics uncovered relationships between structure and performance • First study found that profitability of manufacturing industries in which the largest 8 competitors accounted for more than 70% of sales was nearly twice that of industries with 8 firms concentration less than 70% • Second study explained how certain industries raise prices without attracting competitors 3 Barriers • Cost advantages such as a patent Pharmaceuticals • Product differentiation 3M • Economies of scale Auto production Microchips • These studies reinforced the idea that some industries are inherently much more profitable than others
Problems with analysis • Economists focused on issues of public policy rather than business policy • Bain and his successors used a limited list of structural variables to explain industry profitability thereby shortchanging the richness of modern industrial competition Both these problems were address by Michael Porter in 1974 Porter prepared a note that focused on the business policy objective of profit maximization rather than the public policy of minimizing “excess profits” In 1980 Porter releases his landmark book ‘Competitive Strategy’ Porter used his “Five Forces” approach to understand the attractiveness of and industry environment for the “average” competitor within it
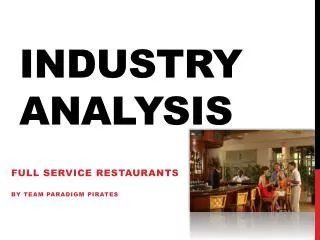
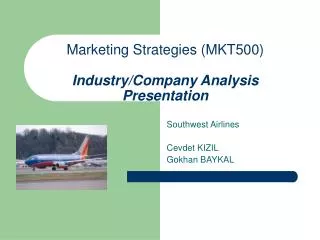
Porter 5 Forces Framework New Entrants Threat of New Entrants IndustryCompetitorsIntensity ofRivalry Buying Powerof Buyers Bargaining PowerofSuppliers Buyers Suppliers Threat of Substitutes Substitutes
Porter 5 Forces Framework Entry BarriersEconomies of ScaleProprietary Product DifferencesBrand IdentitySwitching CostsCapital RequirementsAccess to DistributionAbsolute Cost Advantages- Proprietary learning curve- Access to necessary inputs- Proprietary low-cost product designGovernment PolicyExpected Retaliation Rivalry DeterminantsIndustry GrowthFixed (or Storage) Costs/Value AddedIntermittent Over-CapacityProduct DifferencesBrand IdentitySwitching CostsConcentration and BalanceInformational ComplexityDiversity of CompetitorsCorporate StakesExit Barriers New Entrants Threat of New Entrants IndustryCompetitorsIntensity ofRivalry Buying Powerof Buyers Bargaining PowerofSuppliers Buyers Suppliers Determinants of Supplier PowerDifferentiation of InputsSwitching Costs of Suppliers and Firms in the IndustryPresence of Substitute InputsSupplier ConcentrationImportance of Volume to SupplierCost Relative to Total Purchases in the IndustryImpact of Inputs on Cost or DifferentiationThreat of Forward Integration Relative to the CompetitionThreat of Backward Integration by Firms in the Industry Determinants of Buyer Power Bargaining LeverageBuyer Concentration vs. Firm ConcentrationBuyer VolumeBuyer Switching Costs Relative to Firm Switching CostsBuyer InformationAbility to Backward IntegrateSubstitute ProductsPull-Through Price SensitivityPrice/Total PurchasesProduct DifferencesBrand IdentityImpact on Quality/ PerformanceBuyer ProfitsDecision Makers’ Incentives Threat of Substitutes Substitutes Determinants of SubstitutesRelative Price Performance of SubstitutesSwitching CostsBuyer Propensity to Substitute
Tradeoffs using Porters Model • Framework encompasses many variables and seeks to capture much of the complexity of actual competition • * Porters Framework identifies relevant variables and the questions that users must answer in order to develop conclusions tailored to a particular industry and company* • The drawback of the framework is it often ranges beyond the empirical evidence available • Survey of empirical literature in the late 80’s revealed that only a few points were strongly supported by empirical literature generated by the IO field. These appear in red on the previous slide • One of the breakthroughs built into Porter’s framework was that it emphasized ‘extended competition’ for value rather than just competition among existing rivals • The biggest conceptual advance was proposed in the mid 90’s by two strategist concerned with game theory • Brandenburger and Nalebuff argued that the process of creating value in the marketplace involved “four types of players-customers, suppliers, competitors, and complementors.” • Complementors are other firms from which customers buy complementary products and services . Software or Peripherals for computers • Or which suppliers sell complementary resources
Crucial assumptions built into Porter’s Model McKinsey argues that Porter framework made three critical assumptions: • Industry consists of unrelated buyers, sellers, substitutes and competitors that interact at arm’s length • Wealth will accrue to players that are able to erect barriers against competitors and potential entrants: in other words, that the source of value is structural advantage • Uncertainty is sufficiently low that you can accurately predict participants behavior and choose a strategy accordingly An example of entry barriers that no longer matter PC Financial In the past had to built a branch network now Amicus can provide the services you just create and build a brand
Unbundling Competitive Position • Intra-industry differences in profitability may be larger than differences across industries • Industry-level effects account for 10-20% of variation of profitability while stable within-industry effects account for 30-45% see next 3 slides • Differences in profitability within industries can be even larger • Toyota vs. Ford $2000 vs. $200 profit/vehicle to manufacturer • One might argue that most businesses in most industry environments are better placed to try to alter their own competitive positions rather than the overall attractiveness of the industry in which they operate IE Southwest vs. American • For this reason competitive positioning is interesting to strategists • Hunt believed that competitors within particular industries can be grouped by competitive strategies. • Appliance industry broad line vs. narrow line
Differences in Profitability Within the Pharmaceutical Industry
Competitive Cost Analysis • Several academic views have emerged about the sources of performance differences with industries • Competitive cost analysis survived the declining popularity of the experience curve in the 1970’s but was reshaped in two important ways: • More attention was paid to disaggregating businesses into their component activities or processes and how costs of activities might be shared across businesses • Strategists greatly enriched their menu of cost drivers to include more than just experience • Disaggregating involved splitting costs into the cost of purchased materials and cost added (value added-profit margins) and apply experience curves only to the latter • Next was to disaggregate a business’s entire cost structure into activities whose costs might be expected to behave differently • Activity analysis also provided a way to assign costs in SBU’s • Another development in competitive cost analysis was a better understanding of scale effects • For example advertising costs were driven by national scale whereas distribution costs were driven by local or regional scale
Customer Analysis • Increased sophistication in analyzing relative costs was accompanied by increase attention to customers in the process of analyzing competitive position • This lead to the reconsideration of the idea that attaining low costs and offering customers low prices was always the best way to compete. • More attention came to be paid to differentiated ways of competing that might let a business command a price premium by improving customers’ performance or reducing their other costs • Both Hall and Porter argued that successful companies usually had to choose to compete either on the basis of low costs or by differentiating products through quality and performance • Porter also identified a focus option that cut across these two generic strategies • Debate continued about the proposition explicitly put forth by Porter that businesses stuck in the middle should be expected to under perform businesses that targeted lower costs or differentiated
Porter’s Value Chain • Porters Value chain resembled McKinsey’s business system • He focused on the links within the value chain as well as connecting the value chain to the determinants of competitive position. • Not just how you do things but what you do that determines profitability • Porter asserted that competitive advantage cannot be understood by looking at a firm as a whole but It stems from the many discrete activities it performs • Putting customer analysis and cost analysis together exposed situations in which 20% of a businesses customers accounted for more than 80% or even 100% of its profits The Famous 80/20 Rule Porters Value Chain Firm Infrastructure Human Resource Management Technology Development Procurement Inbound Logistics Outbound Logistics Sales & Marketing Operations Service
Dynamics of Competition • Most ideas and tools for competitive positioning thus far were static in the sense they did not explicitly address the dynamics of the competitive process • How long can competitive advantage be sustained on the assets in place and what are the profitable reinvestment opportunities afforded by strategy • In the 1980’s analysis showed that profitability and growth could not automatically be sustained • Analysis of 700 businesses indicated that nine-tenths of the profitability differential between the below and above average businesses vanished over a 10 year horizon • The Red Queen effect is at work when a predator learns to run faster; its prey responds by acquiring better camouflage; the predator then develops a better sense of smell; the prey starts to climb trees; and so on. • A study of the performance of more than 400 companies over 30 years reveals that firms find it difficult to maintain higher performance levels than do their competitors for more than about five years at a time • How can businesses create and sustain competitive advantage? • Stalk argues that leading edge of competition is the combination of fast response and increasing variety • Companies without these advantages are slipping into commodity-like competition, where customers compete mainly on price • Japanese and the strategic treadmill • Japanese electronics manufactures had reached a remarkable level of efficiency but they did not meet or create needs for their customers
Porter 5 Forces Framework New Entrants Threat of New Entrants IndustryCompetitorsIntensity ofRivalry Buying Powerof Buyers Bargaining PowerofSuppliers Buyers Suppliers Threat of Substitutes Substitutes
Porter 5 Forces Framework Entry BarriersEconomies of ScaleProprietary Product DifferencesBrand IdentitySwitching CostsCapital RequirementsAccess to DistributionAbsolute Cost Advantages- Proprietary learning curve- Access to necessary inputs- Proprietary low-cost product designGovernment PolicyExpected Retaliation Rivalry DeterminantsIndustry GrowthFixed (or Storage) Costs/Value AddedIntermittent Over-CapacityProduct DifferencesBrand IdentitySwitching CostsConcentration and BalanceInformational ComplexityDiversity of CompetitorsCorporate StakesExit Barriers New Entrants Threat of New Entrants IndustryCompetitorsIntensity ofRivalry Buying Powerof Buyers Bargaining PowerofSuppliers Buyers Suppliers Determinants of Supplier PowerDifferentiation of InputsSwitching Costs of Suppliers and Firms in the IndustryPresence of Substitute InputsSupplier ConcentrationImportance of Volume to SupplierCost Relative to Total Purchases in the IndustryImpact of Inputs on Cost or DifferentiationThreat of Forward Integration Relative to the CompetitionThreat of Backward Integration by Firms in the Industry Determinants of Buyer Power Bargaining LeverageBuyer Concentration vs. Firm ConcentrationBuyer VolumeBuyer Switching Costs Relative to Firm Switching CostsBuyer InformationAbility to Backward IntegrateSubstitute ProductsPull-Through Price SensitivityPrice/Total PurchasesProduct DifferencesBrand IdentityImpact on Quality/ PerformanceBuyer ProfitsDecision Makers’ Incentives Threat of Substitutes Substitutes Determinants of SubstitutesRelative Price Performance of SubstitutesSwitching CostsBuyer Propensity to Substitute
Entry Barriers Economies of Scale Proprietary Product DifferencesBrand IdentitySwitching CostsCapital RequirementsAccess to DistributionAbsolute Cost Advantages - Proprietary learning curve - Access to necessary inputs - Proprietary low-cost product designGovernment PolicyExpected Retaliation
Rivalry Determinants Industry GrowthFixed (or Storage) Costs/Value AddedIntermittent Over-CapacityProduct DifferencesBrand IdentitySwitching CostsConcentration and BalanceInformational ComplexityDiversity of CompetitorsCorporate StakesExit Barriers
Determinants of Buyer Power Bargaining LeverageBuyer Concentration vs. Firm ConcentrationBuyer VolumeBuyer Switching Costs Relative to Firm Switching CostsBuyer InformationAbility to Backward IntegrateSubstitute ProductsPull-Through
Epistasis This occurs when interaction between the parts builds to such an extent that any positive change in one part has ripple effects that cause negative change elsewhere. The system thus becomes more conservative as it grows, and finding adaptations that don’t have harmful side effects gets harder and harder.
Determinants of Buyer Power Price SensitivityPrice/Total PurchasesProduct DifferencesBrand IdentityImpact on Quality/PerformanceBuyer ProfitsDecision Makers’ Incentives
Determinants of Supplier Power Differentiation of InputsSwitching Costs of Suppliers and Firms in the IndustryPresence of Substitute InputsSupplier ConcentrationImportance of Volume to SupplierCost Relative to Total Purchases in the Industry
Determinants of Supplier Power Impact of Inputs on Cost or DifferentiationThreat of Forward Integration Relative to the CompetitionThreat of Backward Integration by Firms in the Industry
Determinants of Substitutes Watch Technological developments Relative Price Performance of Substitutes Switching Costs Buyer Propensity to Substitute
To Do’s for Next Week • Email me your contact information please include your major, work history and expectations • Get textbook and case package • Complete the assigned readings • Begin to form groups • Contemplate company/industry for Project *Reminder* The first half of next weeks class will be held in the Library 2nd Floor Research Seminar with Jane Binksma Please be prompt