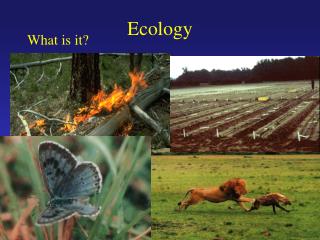
ECOLOGY
310 likes | 464 Views
ECOLOGY. How do I become more productive?. Primary Production and Energy Flow. Ecosystem Ecology. The term “ecosystem” first proposed by Arthur Tansley (1935):

ECOLOGY
E N D
Presentation Transcript
ECOLOGY How do I become more productive? Primary Production and Energy Flow
Ecosystem Ecology • The term “ecosystem” first proposed by Arthur Tansley (1935): • Though the organisms may claim our primary interest,…we cannot separate them from their special environment, with which they form one system. It is the [eco]systems so formed which, from the point of view of the ecologist, are the basic units of nature on the face of the earth.” • Ecosystem Ecology: The study of energy, water and nutrient flows (flux) in ecosystems: • Biotic and abiotic processes • Fundamental areas of interest include primaryproduction, energy flow and nutrient cycling
Definitions • Population: a collection of individuals of the same species • Community: an assemblage of populations in an area or habitat • Ecosystem: a biological community plus all of the abiotic factors influencing that community
Definitions • Production: creation of new organic matter • Primary Production (PP): fixation of energy by autotrophs • PP measured in various ways: • usu. rate of CO2 uptake (g/m2yr1) • Or -- biomass or O2 produced • Gross Primary Production (GPP): total amount of energy fixed (or CO2 taken up) by all autotrophs in an ecosystem. • Net Primary Production (NPP): amount of energy left over after autotrophs have met their own energetic needs (respiration and, ie, the amount of energy available to consumers). NPP = GPP – RPP
Trophic Dynamics • Lindeman (1942): “The Trophic Dynamic Aspect of Ecology” • Trophic dynamics: transfer of energy from one part of an ecosystem to another • First suggested grouping organisms within an ecosystem into trophic levels. • The number of trophic levels in an ecosystem is limited by energy losses with each transfer or conversion of energy between trophic levels
Trophic Dynamics • Each T.L. feeds on T.L. immediately below. • As energy is transferred from one T.L to another, energy is degraded/lost due to: • Limited assimilation • Consumer respiration • Heat production • Energy quantity decreases with each successive trophic level
A Simplified Food Web Secondary Consumers (Predators) Primary Consumers (Herbivores) Primary Producers (Plants)
A Simplified Food Web Secondary Consumers (Predators) PAR Primary Consumers (Herbivores) Primary Producers (Plants)
A Simplified Food Web Secondary Consumers (Predators) PAR Primary Consumers (Herbivores) reflected Primary Producers (Plants) absorbed by Chl a
A Simplified Food Web Secondary Consumers (Predators) PAR Primary Consumers (Herbivores) reflected Primary Producers (Plants) photorespiration heat production absorbed by Chl a
A Simplified Food Web Secondary Consumers (Predators) PAR Primary Consumers (Herbivores) reflected Primary Producers (Plants) photorespiration heat production absorbed by Chl a
A Simplified Food Web Secondary Consumers (Predators) PAR respiration heat production Primary Consumers (Herbivores) limited assimilation reflected Primary Producers (Plants) photorespiration heat production absorbed by Chl a
A Simplified Food Web Secondary Consumers (Predators) PAR respiration heat production Primary Consumers (Herbivores) limited assimilation reflected Primary Producers (Plants) photorespiration heat production absorbed by Chl a
Hence the Trophic Pyramid Biomass and productivity generally decrease with trophic level
Energy Flow In A Temperate Deciduous Forest • Gosz et al. (1978): study of solar energy flux at Hubbard Brook experimental forest: • Of the total energy input via solar radiation: • 15% reflected • 41% converted to heat. • 42% absorbed during evapotranspiration. • 2.2% fixed by plants as GPP • 1.2% used in plant respiration. • 1% left for NPP
Energy Flow In A Temperate Deciduous Forest Gosz et al. 1978: • < 1% of total energy input converted to NPP • Of the NPP available to consumers (herbivores), 96% lost as consumer respiration • Insufficient energy left to support a viable population at a 3rd trophic level.
Factors Controlling Terrestrial PP • PP variable but most strongly correlated with temperature and moisture. • Highest PP under warm, moist conditions • An indicator of PP is actual evapotranspiration (AET): • Total amount of water that evaporates and transpires off a landscape during the course of a year (mm H2O/yr) • affected by temp and precipitation • ecosystems with high AET tend to be warm, receive large amounts of precipitation • ecosystems with low AET tend to be cold, receive little precipitation or both • eg hot deserts and cold tundra have low AET
Among different types of ecosystems, AET is correlated with NPP • Rosenzweig (1968) estimated influence of moisture and temperature on rates of PP by plotting the relationship between annual NPP and AET.
Factors Controlling Terrestrial PP Within similar ecosystems, temps tend to be similar, so moisture (precipitation) tends to be the controlling factor • eg Sala et al. (1988) study of 9,498 sites in the grasslands of central North America:
Factors Controlling Terrestrial PP • Patterns of soil fertility also explain significant variation in NPP within terrestrial ecosystems (assuming equal temp. and moisture) • Liebig (1840): concept of nutrient limitation • Nutrient availability controls patterns of PP in agricultural ecosystems... • NB: Liebig’s law somewhat simplistic: • 2 or more factors may be simultaneously • limiting in many systems Liebig’s Law of the Minimum
Factors Controlling Terrestrial PP ...and in natural ecosystems: • Shaver and Chapin (1986): • Added commercial fertilizer (N+P+K) to several tundra systems in Alaska • NPP 23 – 30% higher on fertilized plots.
Factors Controlling Terrestrial PP • Effects of nutrient additions depend on prior nutrient availability • PP responds to additions of limiting nutrients • eg Bowman et al. (1993): • Experimental fertilization of wet and dry alpine meadows, Niwot Ridge, CO. • Wet meadows had higher initial [N], [P] • 4 treatments: • N; P; N+P; control
Factors Controlling Terrestrial PP Bowman et al. (1993): • Results more dramatic in dry meadow (lower initial [N], [P]) • N, N+P both produced signif. biomass • In contrast, weaker response in wet meadow • only N+P had an effect • sugg. N-limitation in dry meadow; co-limitation in wet meadow • Light might also limit NPP in wet meadow; biomass might produce enough shading to inhibit growth response to nutrient additions. * * * *= statistically significantresponse
Factors Controlling Aquatic PP • Phytoplankton are the dominant primary producers in aquatic ecosystems • Aquatic NPP generally limited by nutrient availability • temperatures generally less variable in the ocean than on land • Several studies have found proportional relationship between [P] and phytoplankton biomass, chlorophyll a and NPP in lakes.
Observational studies in Japan, North America: eg: Hogetsu and Ichimura 1954 Ichimura 1956 Sakamoto 1966 Dillon and Rigler 1974 Smith 1979
Lake Fertilization Experiments • eg. studies at Experimental Lakes Area, Ontario (Mills and Schindler 1987, Findlay and Kasian 1987): • Lake 226 divided by vinyl curtain • Each basin = 8 ha, 500,000 m3 • One side fertilized with P:
Marine NPP is also controlled by nutrient availability • Highest rates of NPP in areas with greatest nutrient availability: • continental margins (runoff from land, bioturbation of bottom sediments) • areas of upwelling (deep nutrient-laden waters rise to euphotic zone) • Open ocean tends to be nutrient poor (relies on vertical mixing for nutrients)
Unlike lakes, marine NPP appears to be limited primarily by [N]: • Granéli et al. (1990) nutrient enrichment experiments, Baltic Sea: • Fertilized flasks containing indigenous phytoplankton spp. • N, P, control treatments • N treatments led to increased chlorophyll concentrations.
Factors Controlling NPP • Temperature and precipitation (terrestrial) and nutrient availability (aquatic) explain most of the variation seen in NPP, but not all: • Residual Variation: proportion of variation not explained by the independent variable. • Dillon and Rigler (1974) suggested environmental factors besides nutrient availability significantly influence phytoplankton biomass.
Summary • Terrestrial Primary Production is generally limited by temperature and moisture. • Aquatic Primary Production is generally limited by nutrient availability. • usually P in freshwater ecosystems • N in marine ecosystems • Energy losses limit the number of trophic levels found in ecosystems.